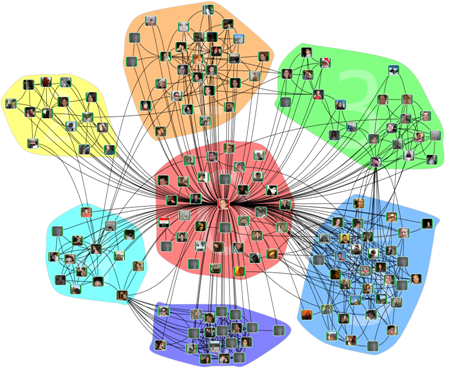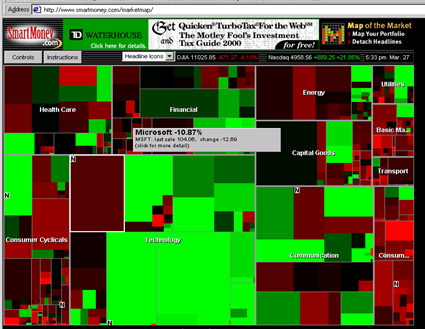

Definition: Visual Analytics is an emerging field that integrates visualization with data analysis to facilitate analytical reasoning. It envisions a discovery process in which humans, algorithms and visualizations interact to solve problems.
Description: This Reconnect conference will introduce participants to basic concepts in visual analytics. Program participants will gain an understanding of how the various components of visual analytics (human, algorithmic, and visualization) can work together to solve large and complex real-world problems in such areas as homeland security and bioinformatics. Each participant will use a variety of algorithms and visualizations; each will work with realistic data sets; and each will write briefs as to how they solved specific problems. There will be a number of video lectures and assigned readings as well as hands on use of several commercial and open source tools.
Prerequisites: Some knowledge of programming, analysis and graphics (at roughly the first year college level) will be assumed. Those with more extensive background will progress more quickly and be able to do more.
Georges bio: Georges Grinstein is
Director of the Institute for Visualization and Perception Research at
the University of Massachusetts Lowell. His work is broad and
interdisciplinary, ranging from perceptual foundations of
visualization to techniques for high-dimensional visualization. His
management of InfoVis and VAST contests in visual analytics has helped
foster many new funded activities. His new Radical Design course
teaches students how to innovate with "radical" new products instead
of evolutionary ones.
 John bio: John Stasko is a
Professor and the Associate Chair of the School of Interactive
Computing at the Georgia Institute of Technology, where he has been a
faculty member since 1989. He is Director of the Information
Interfaces Research Group (http://www.cc.gatech.edu/gvu/ii)
and his primary research area is human-computer interaction, with a
specific focus on information visualization and visual analytics. His
research group is examining ways to help people benefit from, and take
advantage of the large quantities of available information to enrich
their lives. He has been author or co-author of over 120 journal
articles and conference papers on these topics and others. Stasko is
the Director of the Georgia Tech component of the Southeast Regional
Visualization and Analytics Center, sponsored by DHS. He presently is
or formerly has been on the editorial board of the journals ACM
Transactions on Computer-Human Interaction, IEEE Transactions on
Visualization and Computer Graphics, International Journal of
Human-Computer Studies, Journal of Visual Languages and Computing, and
Information Visualization. He was General Chair in 2007 and Papers
Co-Chair in 2005 and 2006 for the IEEE Information Visualization
(InfoVis) Conference, and he is Papers Co-Chair for the 2009 IEEE
Visual Analytics Science and Technology (VAST) Symposium. Stasko
presently servies on the Steering Committee for the IEEE InfoVis
Conference and is an At-Large Member of the IEEE Visualization and Graphics Technical Committee.