STANDARD 13 - ALGEBRA
K-12 Overview
|
All students will develop an understanding of algebraic concepts
and processes and will use them to represent and analyze relationships
among variable quantities and to solve problems.
|
Descriptive Statement
Algebra is a language used to express mathematical relationships.
Students need to understand how quantities are related to one another,
and how algebra can be used to concisely express and analyze those
relationships. Modern technology provides tools for supplementing the
traditional focus on algebraic techniques, such as solving equations,
with a more visual perspective, with graphs of equations displayed on
a screen. Students can then focus on understanding the relationship
between the equation and the graph, and on what the graph represents
in a real-life situation.
Meaning and Importance
Algebra is the language of patterns and relationships through which
much of mathematics is communicated. It is a tool which people can and
do use to model real situations and answer questions about them. It
is also a way of operating with concepts at an abstract level and then
applying them, often leading to the development of generalizations and
insights beyond the original context. The use of algebra should begin
in the primary grades and should be developed throughout the
elementary and secondary grades.
The algebra which is appropriate for all students in the
twenty-first century moves away from a focus on manipulating symbols
to include a greater emphasis on conceptual understanding, on algebra
as a means of representation, and on algebraic methods as
problem-solving tools. These changes in emphasis are a result of
changes in technology and the resulting changes in the needs of
society.
The vision proposed by this Framework stresses the need to
prepare students for a world that is rapidly changing in response to
technological advances. Throughout history, the use of mathematics
has changed with the growing demands of society as human interaction
extended to larger groups of people. In the same way that increased
trade in the fifteenth century required businessmen to replace Roman
numerals with the Hindu system and teachers changed what they taught,
today's education must reflect the changes in content required by
today's society. More and more, the ability to use algebra in
describing and analyzing real-world situations is a basic skill.
Thus, this standard calls for algebra for all students.
What will students gain by studying algebra? In a 1993
conference on Algebra for All, the following points were made
in response to the commonly asked question, "Why study
algebra?"
- Algebra provides methods for moving from the specific to the
general. It involves discovering the patterns among items in a set
and developing the language needed to think about and communicate it
to others.
- Algebra provides procedures for manipulating symbols to
allow for understanding of the world around us.
- Algebra provides a vehicle for understanding our
world through mathematical models.
- Algebra is the science of variables. It enables us to deal
with large bodies of data by identifying variables (quantities which
change in value) and by imposing or finding structures within the
data.
- Algebra is the basic set of ideas and techniques for
describing and reasoning about relations between variable
quantities.
Standard 8 (Numerical Operations) addressed the need for us to
rethink our approach to paper-and-pencil computation in light of the
availability of calculators; the need to examine the dominance of
paper-and-pencil symbolic manipulation in algebra is just as
important. The development of manipulatives, graphing calculators,
and computers have made a more intuitive view of algebra accessible to
all students, regardless of their previous mathematical performance.
These tools permit and encourage visual representations which are more
readily understood. No longer need students struggle with abstract
concepts presented with very few ties to real-life situations.
Rather, the new view of algebra offers real situations for students to
examine, to generalize, and to represent in ways which facilitate the
asking and answering of meaningful questions. Moreover, inexpensive
symbolic processors perform algebraic manipulations, such as
factoring, quickly and easily, reducing the need for drill and mastery
of paper-and-pencil symbol manipulation.
K-12 Development and Emphases
Algebra is so significant a part of mathematics that its foundation
must begin to be built in the very early grades. It must be a part of
an entire curriculum which involves creating, representing, and using
quantitative relationships. In such a curriculum, algebraic concepts
should be introduced in conjunction with the study of patterns and
developed throughout each student's mathematical education. The
earlier students are exposed to informal algebraic experiences, the
more willing they will be to use algebra to represent patterns.
The concept of representing unknown quantities begins with
using symbols such as pictures, boxes, or blanks (i.e., 3 +
 = 7).
It is vital that students recognize that the symbol that is used to
represent an unknown quantity has meaning. The only way this can be
accomplished is to consistently relate the use of unknowns to actual
situations; otherwise, students lack the ability to judge whether
their answers make sense.
= 7).
It is vital that students recognize that the symbol that is used to
represent an unknown quantity has meaning. The only way this can be
accomplished is to consistently relate the use of unknowns to actual
situations; otherwise, students lack the ability to judge whether
their answers make sense.
As students develop their understanding of arithmetic operations,
they need to investigate the patterns which arise. Some of these
patterns (which are commonly called properties) should be
initially expressed in words. As the students develop more facility
with variables, the properties can be expressed in symbolic form.
In the middle grades, problem situations should provide
opportunities to generalize patterns and use additional symbols such
as names and literal variables (letters). This development should
continue throughout the remainder of the program, ensuring that the
relationship between the variables (unknowns) and the quantities they
represent is consistently stressed. Middle school students should
extend their ability to use algebra to generalize patterns by
exploring different types of relationships and by formalizing some of
those relationships as functions. They should explore and
generalize patterns which arise from nature, including non-linear
relationships. As students move into the secondary grades, the
graphing calculator and graphing software provide tools for examining
relationships between x-intercepts and roots, between turning points
and maximum or minimum values, and between the slope of a curve and
its rate of change. As the student continues through high school,
similar experiences should be provided for other functions, such as
exponential and polynomial functions; these functions should be
introduced using situations to which students can relate.
The use of algebra as a tool to model real world situations
requires the ability to represent data in tables, pictures, graphs,
equations or inequalities, and rules. Through exploration of problems
and patterns, students are provided with opportunities to develop the
ability to use concrete materials as well as the representations
mentioned above. Having students use multiple representations for the
same situation helps them develop an understanding of the connections
among them. The opportunity to verbally explain these different
representations and their connections provides the foundation for more
formal expressions.
A fundamental skill in algebra is the evaluation of expressions
and the solution of equations and inequalities.
This process will be easier to understand if it is related to
situations which give them meaning. Expressions, equations, and
inequalities should arise from students' exploration in a variety
of areas such as statistics, probability, and geometry. Elementary
students begin constructing and solving open sentences. The use of
concrete materials and calculators allow them to explore solutions to
real-life situations. Gradually, students are led to expand these
informal methods to include graphical solutions and formal methods.
The relationship between the solutions of equations and the graphs of
the related functions must be stressed regularly.
In summary, there are algebraic concepts and skills which
all students must know and apply confidently regardless of their
ultimate career. To assure that all children have access to such
learning, algebraic thinking must be woven throughout the entire
fabric of the mathematics curriculum.
Note: Although each content standard is discussed
in a separate chapter, it is not the intention that each be
treated separately in the classroom. Indeed, as noted in the
Introduction to this Framework, an effective curriculum is one
that successfully integrates these areas to present students with rich
and meaningful cross-strand experiences.
Standard 13 - Algebra - Grades K-2
Overview
Students can develop a strong understanding of algebraic concepts
and processes from consistent experiences in classroom activities
where a variety of manipulatives and technology are used. The key
components of this understanding in algebra, as identified in the K-12
Overview, are: patterns, unknown quantities, properties,
functions, modeling real-world situations, evaluating
expressions and solving equations and
inequalities.
Students begin their study of algebra in grades K-2 by learning
about the use of pictures and symbols to represent variables. They
look at patterns and describe those patterns. They begin to
look for unknown numbers in connection with addition and
subtraction number sentences. They model the relationships
found in real-world situations by writing number sentences that
describe those situations. At these grade levels, the study of
algebra is very much integrated with the other content standards.
Children should be encouraged to play with concrete materials,
describing the patterns they find in a variety of ways.
People tend to learn by identifying patterns and generalizing or
extending them to some conclusion (which may or may not be true). A
major emphasis in the mathematics curriculum in the early grades
should be the opportunity to experience numerous patterns. The
development of algebra as a language should build on these
experiences. The ability to extend patterns falls under Standard 11
(Patterns and Functions), but having students communicate their
reasoning is also an algebra expectation. Initially, ordinary
language and concrete materials should be used for communication. As
students grow older and patterns become more complex, students should
develop the ability to use tables and pictures or symbols (such as
triangles or squares) to represent numbers that may change or are
unknown (variable quantities).
The primary grades provide an ideal opportunity to lay the
foundation for the development of the ability to represent situations
using equations or inequalities (open sentences) and solving
them. Students can be asked to communicate or represent relationships
involving concrete materials. For example, two students might count
out eight chips and place them on a mat. One of the students then
places a margarine tub over some of the counters and challenges the
other student to figure out how many chips are hidden under the tub.
A more complex situation might involve watching the teacher balance a
box and two marbles with six marbles. The students draw a picture of
the situation, and try to decide how many marbles would balance the
box by physically removing two marbles from each side of the balance.
In a problem involving an inequality, students might be asked to find
out how many books Jose has if he has more than three books but fewer
than ten. Situations from the classroom and the students' real
experiences should provide ample opportunities to construct and solve
such open sentences.
As operations are developed, students need to examine
properties and make generalizations. For example, giving
students a set of problems which follow the pattern 3 + 4, 4
+ 3, 1 + 2, 2+1, etc. should provide the opportunity
to develop the concept that order does not affect the answer when
adding (the commutative property). After students understand that
these properties are not necessarily true for all operations (e.g.,
5 - 2 is not equal to 2 - 5),
the teacher should mention that the properties are important enough to
be given names. However, the focus of this work should be on using
the properties of operations to make work easier rather than on
memorizing the properties and their names.
Students in grades K-2 spend a great deal of time developing
meaning for the arithmetic operations of addition, subtraction,
multiplication, and division. As they work toward understanding these
concepts, they focus on developing mathematical models for
concrete problem situations. The number sentences that they write to
describe these problem situations form a foundation for more
sophisticated mathematical models.
Standard 13 - Algebra - Grades K-2
Indicators and Activities
The cumulative progress indicators for grades K-2 appear below in
boldface type. Each indicator is followed by activities which
illustrate how it can be addressed in the classroom in kindergarten
and in grades 1 and 2.
Experiences will be such that all students in grades K2:
1. Understand and represent numerical situations
using variables, expressions, and number sentences.
- Students represent a problem situation with an open
sentence. For example: If there are 25 students in the
class and Marie brought 26 cookies for snack, how many will be left
over? (26 - 25 = ?) Another example might be:
We have 10 cups left in the package and there are 25
children in the class, so how many more cups do we need to
get?
(10 + ? = 25)
- Students read The Doorbell Rang by Pat Hutchins.
They act out the story and realize that many different combinations of
students can share 12 cookies equally.
- Students make a table relating the number of people and
the number of eyes. They use a symbol such as a stick figure to
represent the number of people and a cartoon drawing of an eye to
represent the number of eyes and then express the relationship between
them.

2. Represent situations and number patterns with concrete
materials, tables, graphs, verbal rules, and number sentences,
and translate from one to another.
- Students in groups are given a container to which they add
water until its height is 5 centimeters, measured with Cuisennaire
rods. They add marbles to the container until the height of the water
is 6 centimeters. They continue adding marbles, recording each time
the number of marbles it takes to raise the water level one
centimeter. They describe the relationship between the number of
marbles added and the height of the water.
- In regular assessment activities, students look at a
series of pictures which form a pattern. They draw the next shape,
describe the pattern in words, and explain why they chose to draw that
shape.
- Using a calculator, students play Guess My Rule.
The lead student enters an expression such as 5+4 and presses
the = key; she shows only the answer to her partner. The
second student tries to guess the rule by entering different numbers,
one at a time, pressing the = key after each number. The
calculator, after each = is pressed, should show the sum
of the entered number and the second addend (in this case, 4). (Some
calculators perform this function differently; see the user's
manual for instructions.) When the second student thinks she knows the
pattern (in this case, adding 4), she makes a guess. The
pattern is written in words and then as a rule using a picture or
symbol forthe variable (the number which the second student
enters).
- Placing four differentcolored cubes in a can, students
predict which color would be drawn out most often if each child draws
one cube without looking. The teacher helps the students keep track
of their results by making a chart with the colors on the horizontal
axis and the number of times a color is drawn on the vertical axis.
As students select cubes, an "x" is placed above the color
drawn, forming a frequency diagram. After several turns, the students
describe the patterns they see in the graph.
- Students read Ten Apples Up on Top! by
Theo Le Sieg and discuss the mathematical comparisons and equations
that appear in the story.
3. Understand and use properties of operations
and numbers.
- Students are given five
computational problems to solve. They are permitted to use the
calculator on only two of them. Two of the problems are related to
another two by operation properties (e.g., 3 + 2 and 4 +
6 are related to 2 + 3 and 6 + 4 by the commutative
property) and the last involves a property of number such as adding
0. Students share their thought processes in a follow up
discussion.
- The second grade teacher has a box containing slips of
paper with open sentences such as 25 - 8 =
or 15
+
= 23. Students draw out a slip and tell or write a story which
would involve a situation modeled by the sentence.
- Students discover that, since the order of the numbers
when adding them is not important, they can solve a problem like 3
+ 8 by starting with 8 and counting up 3, as well as by starting
with 3 and counting up 8.
- In their math journals, students write their
reactions to the following situation:
Sally just used her calculator to find out that 324 + 486 was
equal to 810. In another problem, she must find the answer to
486 + 324. What should she do? Why?
4. Construct and solve open sentences (example:
3 +
= 7) that describe reallife situations.
- Kindergarten students play the hide the pennies
game. The first player places a number of pennies (say 7) on the
table and lets the other player count them. The first player covers
up a portion of the pennies, and the second player must determine how
many are covered. They may represent the situation with markers or
pictures to help them. Some second-grade students are ready to write
a number sentence that describes the situation.
- Students are given a bag with Unifix cubes. They are told
that the bag and 2 cubes balance 7 cubes. They use a balance scale to
find how many cubes are in the bag.
References
-
Hutchins, Pat. The Doorbell Rang. Mulberry Books,
1986.
Le Sieg, Theo. Ten Apples Up on Top! New York, NY:
Random House, 1961.
On-Line Resources
-
http://dimacs.rutgers.edu/archive/nj_math_coalition/framework.html/
The Framework will be available at this site during Spring
1997. In time, we hope to post additional resources relating to this
standard, such as grade-specific activities submitted by New Jersey
teachers, and to provide a forum to discuss the Mathematics
Standards.
Standard 13 - Algebra - Grades 3-4
Overview
Students can develop a strong understanding of algebraic concepts
and processes from consistent experiences in classroom activities
where a variety of manipulatives and technology are used. The key
components of this understanding in algebra, as identified in the K-12
Overview, are: patterns, unknown quantities, properties,
functions, modeling real-world situations, evaluating expressions
and solving equations and inequalities.
In grades K-2, students use pictures and symbols to represent
variables, generalize patterns verbally and visually, and work with
properties of operations. Although the formality increases in grades
3 and 4, it is important not to lose the sense of play and the
connection to the real world that were present in earlier grades. As
much as possible, real experiences should generate situations and data
which students attempt to generalize and communicate using ordinary
language. Students should explain and justify their reasoning orally
to the class and in writing on assessments using ordinary language.
When introducing a more formal method of communicating, such as the
language of algebra, it is helpful to revisit some of the situations
used in previous grades.
Since algebra is the language of patterns, the mathematics
curriculum at this level needs to continue to focus on
patterns. The use of letters to represent unknown
quantities should gradually be introduced as a replacement for
pictures and symbols. The use of function machines permits the
introduction of letters without the need to move to formal symbolic
algebra. Since they have had the opportunity to experience real
function machines such as the calculator or a gum bank, where one
penny yields two pieces of gum, the notation of function machines
should make sense.

Here the box is thought of as the function machine times 2
which takes in a number "a" and produces a number
"b" which is twice "a." Students can use
such symbols to communicate their generalization of patterns. They
put two or more machines together making a composite function; for
example, they can follow the times 2 machine with an add
3 machine. They determine not only what each input produces but
also what input would produce a given output.
 Students should continue to communicate their generalizations
of patterns through ordinary language, tables, and concrete materials.
Graphs should be introduced as a method for quickly and efficiently
representing a pattern or function. They should develop graphs which
represent real situations and be able to describe patterns of a
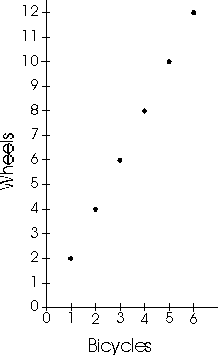
situation when shown a graph. For example, when given the graph at
the right which shows the relationship between the number of bicycles
and wheels in the school yard, they should be able to describe the
relationship in words.
Students should continue to communicate their generalizations
of patterns through ordinary language, tables, and concrete materials.
Graphs should be introduced as a method for quickly and efficiently
representing a pattern or function. They should develop graphs which
represent real situations and be able to describe patterns of a
situation when shown a graph. For example, when given the graph at
the right which shows the relationship between the number of bicycles
and wheels in the school yard, they should be able to describe the
relationship in words.
Students in grades 3 and 4 should continue to use equations and
inequalities to represent real situations. While variables can be
introduced through simple equations such as 35 ÷ n =
5, students should be viewing variables as place holders similar
to the open boxes and pictures they have already used. At these grade
levels, they need not use variables in more complicated situations.
Given a situation such as determining the cost of each CD if 5 of them
plus $3 tax is $23, they should be permitted to represent it in
whatever way they feel comfortable. Students should be able to use,
explain, and justify whatever method they wish to solve equations and
inequalities. Some may continue to use concrete materials for some
situations; they might count out 23 counters, set aside 3 for the tax,
and divide the remainder into 5 equal piles of 4. Others might try
different numbers until they find one that works. Some students may
write
23 - 3 = 20 and 20 ÷ 5 = 4.
Still others may want to relate this to function machines and figure
out what had to go in for $23 to come out. It is important for
students to see the diversity of approaches used and to discuss their
interrelationships.
Students should continue to examine the properties of
operations and use them whenever they would make their work
easier. There are some excellent opportunities for providing a
foundation for algebraic concepts in these grades. For example,
explaining twodigit multiplication by using the area of a rectangle
(see figure below illustrating 13 x 27) provides the student with a
foundation for multiplication of binomials, the distributive property,
and factoring. While the teacher at this grade level should focus on
the development of the multiplication algorithm, the teacher of
algebra several years later will be able to build on this experience
of the student.

Standard 13 - Algebra - Grades 3-4
Indicators and Activities
The cumulative progress indicators for grade 4 appear below in
boldface type. Each indicator is followed by activities which
illustrate how it can be addressed in the classroom in grades 3 and
4.
Building upon knowledge and skills gained in the preceding grades,
experiences in grades 3-4 will be such that all students:
1. Understand and represent numerical situations
using variables, expressions, and number sentences.
2. Represent situations and number patterns with
concrete materials, tables, graphs, verbal rules, and number
sentences, and translate from one to another.
3. Understand and use properties of
operations and numbers.
-
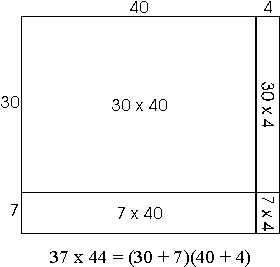 When the students are introduced to twodigit by twodigit
multiplication, they begin with a problem of finding the area of a
rectangular field which is 37 feet by 44 feet. They know they need to
multiply the numbers to find the area, but they don't know how to
multiply without calculators. The teacher draws a rectangle and uses
a line to divide the width into two regions which are 30 feet and 7
feet. She does the same with the length, cutting it into lengths 40
feet and 4 feet. This divides the rectangle into four smaller
rectangles (30×40, 30×4, 7×40,
7×4) all of which are multiplications the students can
do.
When the students are introduced to twodigit by twodigit
multiplication, they begin with a problem of finding the area of a
rectangular field which is 37 feet by 44 feet. They know they need to
multiply the numbers to find the area, but they don't know how to
multiply without calculators. The teacher draws a rectangle and uses
a line to divide the width into two regions which are 30 feet and 7
feet. She does the same with the length, cutting it into lengths 40
feet and 4 feet. This divides the rectangle into four smaller
rectangles (30×40, 30×4, 7×40,
7×4) all of which are multiplications the students can
do.
- Lea and Suzanne discovered a method for multiplying even
numbers by six easily. Their method, applied to the example
6×24, is:
-
| Cut the other even number in half |
12 |
| Add a zero |
120 |
| Add the number |
120+24=144 |
When they told their classmates their discovery, they were stumped
when they were asked why it worked. The teacher, grasping the
teachable moment, divided the class into groupsand challenged
them to do a few examples using the girls' method and try to
figure out and explain why it worked.
- Students and teacher together work through Robert
Froman's book, The Greatest Guessing Game: A Book
about Dividing to reinforce their notions of division.
- Students explain that they solved a problem like 300
- 56 mentally by first subtracting 50 and then
subtracting 6, since that is the same as subtracting 56.
They also do 25×7×4 by first
multiplying 25×4 and then multiplying by 7.
Such simplifications will give a good foundation for later work in
algebra.
4. Construct and solve open sentences (example: 3
+ _ = 7) that describe reallife situations.
- In an assessment situation, groups of students are asked
to describe in words the situation of four people sharing a five
dollar bill found on the way to school, and then to transform it to
symbolic form using pictures, symbols or letters.
- Students want to help the New Jersey environment and raise
money at the same time. They discover that in two bordering states
(New York and Delaware), plastic soda bottles can each be turned in
for a 5 cent refund. They write an equation which represents the
amount of money they will receive for b bottles. Students
answer questions such as How much money will we get for 25
bottles? and How many bottles will we need to make
$10?
- Students are presented with a function machine
representing the situation of buying music tapes for $5 each through
the mail and paying a $3 shipping and handling charge for the order.
They answer questions such as How much would it cost for 5
tapes? and How many tapes were bought if the bill was
$43?

References
-
Fromer, Robert. The Greatest Guessing Game: A Book About
Dividing. New York, NY: Thomas Y. Crowell Publishers,
1978.
Hutchins, Pat. 1 Hunter. New York, NY: Greenwillow
Books, 1982.
On-Line Resources
-
http://dimacs.rutgers.edu/archive/nj_math_coalition/framework.html/
The Framework will be available at this site during Spring
1997. In time, we hope to post additional resources relating to this
standard, such as grade-specific activities submitted by New Jersey
teachers, and to provide a forum to discuss the Mathematics
Standards.
Standard 13 - Algebra - Grades 5-6
Overview
Students can develop a strong understanding of algebraic concepts
and processes from consistent experiences in classroom activities
where a variety of manipulatives and technology are used. The key
components of this understanding in algebra, as identified in the K-12
Overview, are: patterns, unknown quantities, properties,
functions, modeling real-world situations, evaluating expressions
and solving equations and inequalities.
It is important that students continue to have informal
algebraic experiences in grades 5 and 6. Students have
previously had the opportunity to generalize patterns, work informally
with open sentences, and represent numerical situations using
pictures, symbols, and letters as variables, expressions, equations,
and inequalities. At these grade levels, they will continue to build
on this foundation.
Algebraic topics at this level should be integrated with the
development of other mathematical content to enable students to
recognize that algebra is not a separate branch of mathematics.
Students must understand that algebra is an expansion of the
arithmetic and geometry they have already experienced and a tool to
help them describe situations and solve problems.
Students should use algebraic concepts to investigate situations
and solve interesting mathematical and real world
problems. There should be numerous opportunities for collaborative
work. Since algebra is the language for describing patterns,
students should have regular and consistent opportunities to discuss
and explain their use of these concepts. They should write
generalizations of situations in words as well as in symbols. To
provide such opportunities, the activities should move from a concrete
situation or representation to a more abstract setting. Students at
this level can begin using standard algebraic notation to represent
known and unknown quantities and operations. This should be
developed gradually, moving them from the previous symbols in such a
way that they can appreciate the power and elegance of the new
notation.
Students need to learn how variables are different from numbers (a
variable can represent many numbers simultaneously, it has no place
value, it can be selected arbitrarily) and how they are different from
words (variables can be defined in any way we want and can be changed
without affecting the values they represent). Students need to see
variables (letters) used as names for numbers or other objects, as
unknown numbers in equations, as a range of unknown values in
inequalities, as generalizations in pattern rules or formulas, and as
characteristics to be graphed (independent and dependent
variables).
An algebraic expression involves numbers, variables, and
operations such as 2b, 3x - 2, or
c - d. In fifth and sixth grade, students
should begin to become familiar with the common notational shortcut of
omitting the operation sign for multiplication, so that when
b=3, 2b equals 6 and not 23. Thus they
recognize that there are slightly different rules for reading
expressions involving variables than those involving only numbers.
Students in grades 5 and 6 should focus on understanding the role
of the equal sign. Because it is so often used to signal the answer
in arithmetic, students may view it as a kind of operation sign -
a "write the answer" sign. They need to come to see its
role as a relation sign, balancing two equal quantities. Students
should develop the ability to solve simple linear equations
using manipulatives and informal methods. With the appropriate
background, students at grades 5 and 6 have the ability to find the
solution of an equation, such as 7 for x+5=12, whether
they use manipulatives, a graph, or any other method. It is
imperative that in the discussion of the solution of an equation, the
many methods in obtaining that solution are described.
Students in grades 5 and 6 should use concrete materials, such as
algebra tiles, to help them develop a visual, geometric understanding
of algebraic concepts. For example, students can represent the
expression 3x - 2 by using three strips and two
units. They should make graphs on a rectangular coordinate system
from data tables, analyze the shape of the graphs, and make
predictions based on the graphs. Students should have opportunities
to plot points, lines, geometric shapes, and pictures. They should
use variables to generalize the formulas they develop in studying
geometry (e.g., p = 4s for a square or A = l×w for a
rectangle). Students should be able to describe movements
of objects in the plane through horizontal and vertical slides
(translations). They should experiment with probes which generate the
graphs of experimental data on computers or graphing calculators. The
majority of this work will be with graphs that are straight lines
(linear functions), but students should have some experience seeing
other shapes of graphs as well; in particular, when dealing with real
data and probes, many times the graph will not be linear.
Standard 13 - Algebra - Grades 5-6
Indicators and Activities
The cumulative progress indicators for grade 8 appear below in
boldface type. Each indicator is followed by activities which
illustrate how it can be addressed in the classroom in grades 5 and
6.
Building upon knowledge and skills gained in the preceding grades,
experiences in grades 5-6 will be such that all students:
5. Understand and use variables, expressions,
equations, and inequalities.
6. Represent situations and number patterns with
concrete materials, tables, graphs, verbal rules, and standard
algebraic notation.
- Each group of students is given a Mr. or
Mrs. Grasshead (i.e., a sock filled with dirt and grass seed
which sits in a dish of water). They create a name for their
grasshead and begin a diary, recording the number of days that have
passed and the height of the grass. At the end of specified time
periods, they discuss the changes in the height, the average rate of
change over the time period, and the overall behavior of the grass
growth. Each group makes a graph of height versus the number of days.
The students note whether the graph is close to a straight line.
- Students find the number of tiles around the border of a
floor 10 tiles long and 10 tiles wide by looking at smaller square
floors, making a table, and identifying a pattern. They describe
their pattern in words and, with assistance from the teacher, develop
theexpression (4 × n) + 4 for the number of border tiles
needed for an n × n floor.
- Students play Guess My Rule by suggesting
input and having the rule-maker (the teacher or a student) put
the corresponding output into a table like this one:
| Input |
Output |
| 3 |
9 |
| 1 |
5 |
| 16 |
35 |
| . |
. |
| . |
. |
| . |
. |
| n |
2n+3 |
Students should always be challenged to show they understand the
rule by filling in the last row for an input of n. Partially
filled-in Guess My Rule tables are also a good assessment
technique to evaluate students' inductive reasoning power and
their ability to use standard algebraic notation to express
relationships.
- Students use play money to act out the following situation
and solve the problem.
A man wishes to purchase a pair of slippers marked $5. He gives
the shoe salesman a $20 bill. The salesman does not have
change for the bill so he goes to the pharmacist next door and
gets a $10 and two $5 bills. He gives the customer his change
and the man leaves. The pharmacist enters shortly after and complains
the $20 was counterfeit. The shoe salesman gives her $20 and
gives the counterfeit bill to the FBI. How much did the shoe
salesman lose?
- Students place 8 two-color chips in a
paper cup and toss them ten times, recording the number of red and
yellow sides showing on each toss. For each red chip that shows, they
lose $1. For each yellow, they win $1. For each toss, the students
write a number sentence that shows their win or loss for that toss.
For example, after tossing 3 yellows and 5 reds, their sentence would
read 3 - 5 = -2. Afterwards, the students look for patterns
in the number sentences that they have written. They discuss these
patterns and then write about them in their notebooks.
-
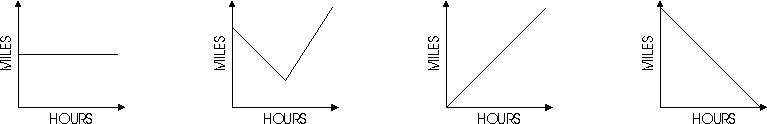
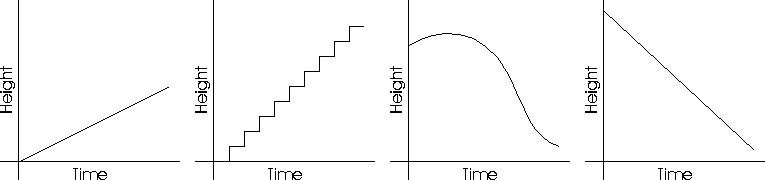
In both classroom and assessment situations,
students interpret simple non-numeric graphs and decide what kinds of
relationships they demonstrate. For example: Which of the
following graphs would show the relationship between the height
of a flag and time as a boy scout raised the flag on a
flagpole?
- Students work through the Powers of the Knight
lesson that is described in the Introduction to this Framework.
They learn that doubling the number of coins on consecutive
squares of a chessboard results in a rapidly increasing sequence of
numbers - the powers of 2.
- Students read Anno's Mysterious Multiplying
Jar by Mitsumasa Anno and try to analyze and represent the
numerical patterns shown using variables.
7. Use graphing techniques on a number line to
model both absolute value and arithmetic operations.
- Students use number lines to demonstrate addition of
integers. They point to the number representing the amount currently
in the bank and then slide their finger in the appropriate direction
(right for deposits and left for withdrawals) over the distance
indicated by the second amount. As they slide their finger, they use
arrows to track their movements over the number line, and the teacher
keeps track of the operations using positive and negative integers.
Through this dual representation, students begin to understand the
relationship between the addition of integers and movement along the
number line.
- Students are given a variety of objects whose dimensions
they must determine. They are given a number line marked from 5 to 27
to simulate a broken yardstick. Students work in pairs to develop a
process for determining the lengths of each of the objects to the
nearest unit. After they have a workable method and have written an
explanation of it in their journal, the teacher replaces the tape with
another which is marked from 10 to 10. The students repeat their
effort. This process helps them develop an understanding of
subtraction of integers and the relationship between the operation of
subtraction and distance on the number line.
- Addition and subtraction of signed numbers is explored
using two-colored disks and a number line. Red is used to represent
positive numbers and yellow is used to represent negative numbers.
When given a problem such as -3 + 5 the students place 3
yellows and 5 reds on the table. They pair up as many red and yellow
disks as they can and remove them from the table. In the case of the
example, 3 red and yellow disks would be paired and removed, leaving 2
red disks which represents the sum, +2.
8. Analyze tables and graphs to identify
properties and relationships.
- Students use tables or
two-color chips to help them solve the following problem: A
classroom has 25 lockers in a row. The first person to enter
the room opened every locker. The second person closed every
other locker beginning with the second locker. The third person
started with the third locker and changed every third locker from open
to closed or closed to open. This continued until 25 people
had passed through the room. Which lockers would be open after
the 25th person walked into the room?
-
 A plastic rectangular shape is exhibited on the overhead. The
lengths of both sides of the image, and the distance from the screen
to the overhead are measured. The overhead is moved and the process
is repeated so that measurements are taken at six to ten different
distances. One group of students is responsible for determining
the relationship between the distance from the screen and the
length of one side of the image. A second group is responsible for
studying the relationship between the distance from the screen and the
area of the image. Each group makes a scatterplot of its data and
eyeballs a line of best fit using a piece of spaghetti. They then use
the graph to answer questions about the relationship between distance
and length or distance and area. They also develop a summary
statement describing the relationship.
A plastic rectangular shape is exhibited on the overhead. The
lengths of both sides of the image, and the distance from the screen
to the overhead are measured. The overhead is moved and the process
is repeated so that measurements are taken at six to ten different
distances. One group of students is responsible for determining
the relationship between the distance from the screen and the
length of one side of the image. A second group is responsible for
studying the relationship between the distance from the screen and the
area of the image. Each group makes a scatterplot of its data and
eyeballs a line of best fit using a piece of spaghetti. They then use
the graph to answer questions about the relationship between distance
and length or distance and area. They also develop a summary
statement describing the relationship.
- Students make pendulums using strings of length 64, 32,
16, and 8 cm with a washer at one end and a screw eye or ruler at the
other. The strings are swung from a constant height and the number of
swings in 30 seconds is recorded. A graph is made plotting the number
of swings against the string length. Students study the results and
determine if there might be a pattern they could continue. They
attempt to answer questions such as: Will the number of swings ever
reach zero? (This activity is a good one to repeat at later
grades since the relationship appears linear but when very short
lengths and very long lengths are used, it becomes clear that it is
actually a quadratic relationship.)
- Students are given the times of the Olympic 100meter
freestyle swimming winners both in the men's event and the
women's event. Using different colors for the two genders, they
produce a scatterplot and use a piece of spaghetti to eyeball a line
of best fit for each set of data. They use their lines to determine
times in the years not given (when no Olympics were held) and to
predict times in the years beyond those they were given. They also
determine if the data supports the assertion that the women will some
day swim as fast as the men and predict from their lines when that
would happen.
9. Understand and use the rectangular coordinate
system.
- Students are paired to play a game similar to battleship
in which they attempt to determine where the two lines their opponent
has drawn intersect. Both students draw axes which go from -10
to 10 in both the x and ydirections. They sit so that neither can see
the other's paper. The first player draws two lines which
intersect at a point with integer coordinates and colors the four
regions different colors. The second player gives the coordinates of
a point. The first player responds with the color of the region the
point is in, or that the point is on a line, or that it is the
point! The second player keeps a record of his guesses on his
axes and continues guessing until the chosen point is determined.
- Students keep track of the high and low temperatures for a
month in two different colors on a graph. The horizontal axis
represents the day of the month and the vertical axis represents the
temperature. At the end of the month, they connect the points making
two broken-line graphs. They use their graphs to discuss the
temperature variations of that month and to determine the overall
"high" and "low" for the month.
- Students consider what happens if they start with two
bacteria and the number of bacteria doubles every hour. They make a
table showing the number of hours that have passed and the number of
bacteria and then plot their results on a coordinate graph.
- Students draw broken-line pictures in a cartesian plane
and identify the coordinates of critical points in the pictures.
Their partners attempt to re-create the picture using the coordinates
of the critical point and verbal descriptions of how the critical
points should be connected.
10. Solve simple linear equations using
concrete, informal, and graphical methods, as well as
appropriate paper-and-pencil techniques.
- Students use algebra tiles to solve an equation. For
example, they represent the equation 3x + 2 = 5x by placing
three strips and two units on one side of a picture of a balance beam
and five strips on the other side. They decide that the balance will
stay even if they take the same number of objects off both sides, so
they take three strips off both sides and have two units balanced with
two strips. Then they correctly decide that 1 unit must balance one
strip.
- Students want to use their class fund as a donation to a
town in Missouri devastated by the summer floods. They agree that
each of the 26 students in the class is going to contribute 25 cents a
week. The fund already contains $7. The students develop the
expression $6.50×W+$7 as the amount of money in the
fund at the end of W weeks. The teacher asks them how much they would
like to send to the town, and the students agree on $100. The teacher
then asks them to write an equation which would say that the amount of
money after W weeks was $100. The students write
$6.50×W + $7 = $100. Finally, the students try a
number of different strategies for finding out what W should be. Some
of the students use calculators in a guessandcheck method. Some
students go to the computer and use a spreadsheet to generate the
amounts for different weeks until the total is more than $100. Others
express the relationship as a composite function using function
machines and then use the inverse operations to subtract $7 and then
divide by $6.50. They use their calculators to carry out the division.
The teacher discusses all these methods and introduces the traditional
algebraic shorthand method for solving the problem.
11. Explore linear equations through the use
of calculators, computers, and other technology.
- Using a motion sensor connected to a graphing calculator
or computer, the class experiments with generating graphs which
represent the distance from the sensor against time. They discover
that if they walk at a fixed rate the graph is a straight line. They
try walking away from the sensor at different fixed rates of speed to
determine what effect the speed has on the line. They start at
different distances from the sensor to see the effect that has. They
try walking toward the sensor and standing still. Students discuss
the relationships between the lines they are generating and the
physical activity they do. As an assessment, the teacher has
individual students walk so as to generate a straight line. The
students are then asked to write in their journals what someone would
have to do to produce a line which was less steep. After closing
their journals, individual students are provided an opportunity to
verify their conclusions using the graphing calculator.
- After measuring several students' heights and the
length of the shadows they produce, the data is entered in a
spreadsheet, computerized statistics package, or graphing
calculator. A scatterplot is formed from the data and the students see
that the plot is approximately linear. The technology is used to
produce a line of best fit which the class uses to determine heights
of unknown objects (such as a flagpole) and the length of the shadow
of objects with known heights.
12. Investigate inequalities and nonlinear
equations informally.
- Students explore patterns involving
the sums of the odd integers (1, 1+3, 1+3+5, ...) byusing small
squares to make Ls to represent each odd number and then nesting the
Ls. They make a table that shows how many Ls are nested and the total
number of squares used.

They look for a pattern that will help them predict how many
squares will be needed if 10 Ls are nested (i.e., if the first 10 odd
numbers are added together). They make a prediction and describe the
basis for their prediction (e.g., when you added the first 3 odd
numbers, and placed the three Ls together, they formed a square that
was three units on a side, so when you add the first 10 odd numbers,
that should make a square that is ten units on a side and whose total
area is 100 squares.) They share their solution strategies with each
other and develop an expression that can be used to find the sum of
the first n odd numbers (i.e., n × n).
- Students set up a table listing the length of the sides of
various squares (x) and their areas (y). Some students use the
centimeter blocks to help them find the values. The teacher completes
a table of values in a function graphing computer package on the class
computer which has an LCD panel for overhead projection or on an
overhead version of a graphing calculator. When the students have
finished completing the table, the teacher turns on the overhead and
displays her table. The students check their answers and ask
questions. The teacher graphs the data on the computer or calculator,
and the students use the graph to answer questions such as If the
side was 3.5 cm, what would the area be? and If the
area was 60 square centimeters, what would the side be?
The teacher uses the trace function to identify the points being
discussed.
- Students explore inequality situations such as: I have
$150. How many more weeks would I need to save my $15
allowance to buy a stereo that costs $200? They represent the
relationship as an inequality, both in words and in symbols, and use
play money, base ten blocks, graphs, or trial and error to solve the
problem.
13. Draw freehand sketches of, and interpret,
graphs which model real phenomena.
- Students keep track of how far they are from home during
one specified day. They draw a graph which represents the distance
from home against the time of day and write an explanation of their
graph in relation to their actual activities on that day.
- Students are presented with a graph representing a
student's monthly income from performing lawn care for people
over the past year. The graph shows no income during the months of
November, December, and March. They write a story which explains the
behavior of the graph in terms of the need for services over the
course of the year.
References
-
Anno, Mitsumasa. Anno's Mysterious Multiplying
Jar. Philomel Books, 1983.
On-Line Resources
-
http://dimacs.rutgers.edu/archive/nj_math_coalition/framework.html/
The Framework will be available at this site during Spring
1997. In time, we hope to post additional resources relating to this
standard, such as grade-specific activities submitted by New Jersey
teachers, and to provide a forum to discuss the Mathematics
Standards.
Standard 13 - Algebra - Grades 7-8
Overview
Students can develop a strong
understanding of algebraic concepts and processes from consistent
experiences in classroom activities where a variety of manipulatives
and technology are used. The key components of this understanding in
algebra, as identified in the K-12 Overview, are: patterns,
unknown quantities, properties, functions, modeling real-world
situations, evaluating expressions and solving equations
and inequalities.
Students in grades 7 and 8 continue to explore algebraic concepts
in an informal way. By using physical models, data, graphs, and other
mathematical representations, students learn to generalize number
patterns to model, represent, or describe observed physical
patterns, regularities, and problems. These informal explorations
help students gain confidence in their ability to abstract
relationships from contextual information and use a variety of
representations to describe those relationships. Manipulatives such
as algebra tiles provide opportunities for students with different
learning styles to understand algebraic concepts and manipulations.
Graphing calculators and computers enable students to see the
behaviors of functions and study concepts such as slope.
Students need to continue to see algebra as a tool which is useful
in describing mathematics and solving problems. The algebraic
experiences should develop from modeling situations where
students gather data to solve problems or explain phenomena. It is
important that all concepts are presented within a context, preferably
one meaningful to students, rather than through traditional symbolic
exercises. Once a concept is well-understood, the students can use
traditional problems to reinforce the algebraic manipulations
associated with the concept.
Many activities which are used in earlier grades should be
revisited as students become more sophisticated in their use of
algebra. At the same time, activities used in later grades can be
incorporated on an informal basis. For example, students in earlier
grades might have gathered the heights and armspans and attempted to
generalize the relationship between them in words. As students became
familiar with the rectangular coordinate system, they might have
generalized the relationship using a scatterplot and fitting a line to
the data. In seventh and eighth grade, students might be taught how
to find the medianmedian line to determine the line of best fit and
use that line to solve problems. In later grades, when students have
learned to find the slope of a line through two points symbolically,
they can determine the equation of the median-median line. (The
median-median line, available on many calculators which have
statistics capabilities, is found by dividing the data points on the
x-y plane into three equal sets, grouped by x-value, finding a single
point for each set whose coordinates are the medians of the respective
coordinates of the points in the set, connecting the first and third
points by a straight line, and shifting this line 1/3 of the way
toward the second point.)
Students should have numerous opportunities to develop an
understanding of the relationship between a function and its graph. A
limited number of functions should be plotted by hand, but students
should also use technology to graph functions. While linear
relationships should be the focus, inequalities and nonlinear
functions should be explored as well. Students should develop an
understanding of the relationship between solutions of equations and
graphs of functions. For example, the solution of the equation 3
x - 4 = 5 can be found by plotting y = 3x
- 4, tracing along the function until a y-value of 5is
found, and then determining the corresponding x-value. Students
should develop the ability to find solutions using the trace function
of graphing calculators and computer graphing programs and discuss how
it assists in solving equations. They should also have opportunities
to use spreadsheets as a method for representing and solving problems.
Students should be able to evaluate expressions using all
forms of real numbers when calculators are available. They should
have developed an understanding of the importance of the algebraic
order of operations and be able to correctly evaluate expressions
using it. It is imperative that students understand that they cannot
blindly accept answers produced on the calculator. They should
recognize that a standard fourfunction calculator does not use the
standard order of operations. They should recognize that even with a
scientific calculator, operations such as the division of two binomial
quantities requires the use of parentheses.
Students should refine their ability to solve simple linear
equations (i.e., ax+b=cx + d). Students may continue to
use informal, concrete, and graphic methods but should begin to link
these methods to more formal symbolic methods. As students have
opportunities to explore interesting problems, applications, and
situations, they need to be encouraged to reflect on their
explorations and summarize concepts, relationships, processes, and
facts that have emerged from their discussions. Developing a suitable
notation to describe these conclusions leads naturally to a more
formal, more symbolic view of algebra.
Standard 13 - Algebra - Grades 7-8
Indicators and Activities
The cumulative progress indicators for grade 8 appear below in
boldface type. Each indicator is followed by activities which
illustrate how it can be addressed in the classroom in grades 7 and
8.
Building upon knowledge and skills gained in the preceding grades,
experiences in grades 7-8 will be such that all students:
5. Understand and use variables, expressions,
equations, and inequalities.
6. Represent situations and number patterns with concrete
materials, tables, graphs, verbal rules, and standard algebraic
notation.
- The seventh grade is preparing for a skiing trip. The
interdisciplinary team has decided to integrate the planning for the
trip into all the courses. One of the items being discussed in math
class is the number of buses that will be required. Since the actual
number of people is not yet determined, the situation is best modeled
with variables and unknowns. Knowing that each bus holds 35 people,
students develop a table based on 5 or 6 different numbers of people
on the trip, in an attempt to find a pattern. Some students who
require more concrete operations to develop a sense of the pattern use
unit cubes and decimal rods to represent the situation with different
numbers of people. The group works together to develop a graph based
on their findings. The discussion begins with one person
suggestinggraphing the points (35,1), (70,2), and
(105,3) and then connecting them with a straight line. The
teacher does this (in a way that can be readily erased later) and asks
the class if there is any problem with this solution. More discussion
leads to understanding that the graph would be made up of discrete
points since there cannot be fractions of people and the graph would
not be a straight line but a series of steps 35 people long and going
up by 1 bus. Students are able to verbalize the rule but are curious
as to how it would be represented symbolically. The teacher shows
them the symbol for the step function, _x_.
- Students construct squares on each side of right triangles
on their geoboards, then find the area of each square. They record
their results in a table and look for a pattern, leading them to
"discover" the Pythagorean Theorem.
7. Use graphing techniques on a number line to
model both absolute value and arithmetic operations.
- Students use a graphic representation of the mapping
resulting from a multiplication by a negative number (such as 2 as
shown below) to explain why the order of the inequality reverses when
both sides are multiplied by that negative number.
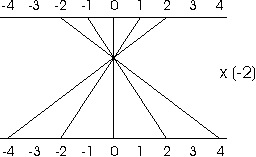
They explain that while the original sequence of inputs is
ascending {2,1,0,1,2}, the images are descending
{4,2,0,2,4}.
- Presented with an absolute
value equation such as | x - 5 | < 3, the students use the
idea that this means identifying all the points which are 3 units or
less from 5. They represent the solution set with dots at 2 and 8 and
a line connecting them.
- Students represent multiplication of integers on the
number line as repeated addition. They use the idea that 3
× 4 is 4 + 4 + 4, and, on the number line, it
would be represented by three segments, each four units in length,
placed end to end starting at zero. The students write in their
journals how they would picture 3 × (4).
After reviewing their responses and clarifying concerns, they discuss
that (3) × (4) would be the opposite
of 3 × (4).
8. Analyze tables and graphs to identify
properties and relationships.
9. Understand and use the rectangular coordinate
system.
- Students draw the quadrilateral ABCD, where the
coordinates of the vertices are A(3,2), B(4,7), C(2,3), and D(5,6).
They produce the figure that results from a size change of 1/2 and
then slide that quadrilateral left 3 units and down 5.
- Students understand that the point (5,3) is the
intersection of two lines which have the equations x=5 and
y=3. They can identify quickly lines with equations
such as x=5 and y=3. They can identify the half
planes and intersections of half planes identified by inequalities
such as x>5 and y< 3.
- Students study the relationship between perimeters and
areas of rectangles. Some students keep the perimeter constant and
study the changes in area while others keep the area constant and
study the changes in perimeter. Both groups plot their results as
graphs and look for patterns.
- Students use squares or grid paper to study the
relationship between the radius of a circle and its area (found by
counting squares on centimeter grid paper). They graph their data and
use it to predict the area of a circle of radius r.
- Students play Green Globs on the computer, entering
equations and trying to hit as many globs as possible with them.
10. Solve simple linear equations using
concrete, informal, and graphical methods, as well as
appropriate paper-and-pencil techniques.
- Presented with a picture of a balance scale showing
objects with unknown weights on both sides as well as known weights
(e.g., 3x + 12 = 7x + 4), students identify the standard
algebraic equation related to the picture, describe in words how it
would be solved using the concrete objects on the balance scale, and
record their actions symbolically.
- Students use algebra tiles to solve an equation like
3(2x + 5) = 21. They first place 21 units on the right and
three groups of two strips and five units on the left. They then note
that this is the same as saying 6 strips and 15 units balance 21 units
(6x + 15 = 21). Then they take 15 units off both sides, leaving
6 strips balanced with 6 units (6x = 6). They conclude that one
strip must equal one unit (x = 1).
- As part of a regular exam, students write a verbal
explanation describing the relationship between the function
y=2x+4, its graph, and the equation 2=2x+4.
11. Explore linear equations through the use
of calculators, computers, and other technology.
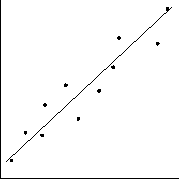
- The students perform an experiment to answer the question
about how long it would take a wave to go around Veterans'
Stadium. They gather data by timing waves done by a various
numbers of people, plot the data, and determine the line of best fit
using the medianmedian line method. They determine the number of
people that could sit around Veterans Stadium, but they discover that,
unlike the previous data sets, they cannot use the graph to answer the
question directly. The teacher explains that they need to determine
an equation for the line. She has the students investigate functions
of the form y=mx+b using a graphing calculator in order to
develop the idea that m represents the slope and b
represents the y-intercept.
- Using a motion detector connected to a computer or
graphing calculator, the teacher has students walk so that the
distance from the detector plotted against time is a straight
line. The teacher gives directions to students such as: Walk so
that the line has a positive slope, Walk so that the slope is
steeper than the last line, Walk so that the line has a slope of
0, or Walk so that the line has a negative slope.
12. Investigate inequalities and nonlinear
equations informally.
- Presented with the information that the Cape MayLewes
Ferry has space for 20 cars, and a bus takes up the space of 3 cars,
students are asked to draw a graph which represents how many cars and
how many buses can be taken across on one trip. Students use
variables to represent the unknowns (x for cars and y for
buses) and develop the inequality x+3y < 20 as a model for
the situation. Recognizing that the solutions have to be whole
numbers, they identify the points whose coefficients are non-negative
integers and in the first quadrant on or below the line.
- Students use a motion detector, connected to a calculator
or computer, to record the motion of a ping-pong ball tossed by a
small catapult. The motion detector is on the floor below the
trajectory of the ball. Students note that the graph of distance
against time is not linear. They experiment with different initial
velocities and different release points to see how these affect the
graph.
13. Draw freehand sketches of, and interpret,
graphs which model real phenomena.
- Students are asked to draw a sketch of the graph which
would describe a person's distance off the ground during a ride
on a ferris wheel which had a radius of 60 feet. Some students just
draw a curve that looks similar to a sine curve. Others put more
detail into their drawing showing the step function behavior which
occurs as people get on and get off and that there are limited
revolutions permitted.
- Presented with a graph showing the population of frogs in
a local marsh over the past ten years, students generate hypotheses
for why the curve has the shape it does. They check their hypotheses
by talking with a local biologist who has studied the marsh over this
time period.
References
-
New Jersey State Department of Education. Mathematics
Instructional Guide. D. Varygiannes, Coord. Trenton:
1996.
Software
-
Green Globs and Graphing Equations.
Sunburst Communications.
On-Line Resources
-
http://dimacs.rutgers.edu/archive/nj_math_coalition/framework.html/
The Framework will be available at this site during Spring
1997. In time, we hope to post additional resources relating to this
standard, such as grade-specific activities submitted by New Jersey
teachers, and to provide a forum to discuss the Mathematics
Standards.
Standard 13 - Algebra - Grades 9-12
Overview
Students can develop a strong understanding of algebraic concepts
and processes from consistent experiences in classroom activities
where a variety of manipulatives and technology are used. The key
components of this understanding in algebra, as identified in the K-12
Overview, are: patterns, unknown quantities, properties,
functions, modeling real-world situations, evaluating expressions,
and solving equations and inequalities.
With the foundation developed in the K8 program, students should be
able to be successful in most secondary algebra programs. However,
instructional strategies should continue to focus on algebra as a
means for representing and modeling real situations and
answering questions about them. The traditional methods of teaching
algebra have been likened to teaching a foreign language, focusing on
grammar and not using the language in real conversation. Algebra
courses and programs must encourage students to "speak the
language" as well as use "proper grammar."
Algebraic understanding is necessary for all students regardless of
the structure of the 912 program. Students in mathematics programs
from technical/basic through college preparatory programs should learn
a common core of algebra, with the remainder of the program based on
their particular needs. All students should learn the same basic
ideas. All students benefit from instructional methods which provide
context for the content. Such an approach makes algebra more
understandable and motivating.
Techniques for manipulating algebraic expressions remain important,
especially for students who may continue into a calculus program.
These can be woven into the curriculum or they might all be combined
into separate courses labeled "algebra" taken by students
who intend to pursue a mathematicsrelated career. No matter how this
instruction is organized, however, instruction must produce students
who understand the logic and purposes of algebraic procedures.
Students should be comfortable with evaluating expressions
and with solving equations and inequalities, by whatever means
they find most appropriate. They should understand the relationship
between the graphs of functions and their equations. Prior to high
school, they have focused predominantly on linear functions. In high
school, students should gain more familiarity with nonlinear
functions. They should develop the ability to solve equations and
inequalities using appropriate paperandpencil techniques as well as
technology. For example, they should be able to understand and solve
quadratic equations using factoring, the quadratic formula, and
graphing, as well as with a graphing calculator. They should
recognize that the methods they use can be generalized to be used when
functions look different but are actually composite functions using a
basic type (e.g., sin2 x + 3 sin x + 2 = 0
is like x2 + 3x + 2 = 0); this
method is sometimes called "chunking." This use of
patterns to note commonalities among seemingly different
problems is an important part of algebra in the high school.
Algebraic instruction at the secondary level should provide the
opportunity for students to revisit problems. Traditional school
problems leave students with the impression that there is one right
answer and that once an answer is found there is no need to continue
to think about the problem. Since algebra is the language of
generalization, instruction in this area should encourage students to
ask questions such as Why does the solution behave this way?
They should develop an appreciation of the way algebraic
representation canmake problems easier to understand. Algebraic
instruction should be rich in problems which are meaningful to
students.
Algebra is the gatekeeper for the future study of mathematics and
of science, social sciences, business, and a host of other areas. In
the past, algebra has served as a filter, screening people out of
these opportunities. For New Jersey to be part of a global society,
it is important that 912 instruction in algebra play a major role in
the culminating experiences of a twelveyear program that opens these
gates for all.
Standard 13 - Algebra - Grades 9-12
Indicators and Activities
The cumulative progress indicators for grade 12 appear below in
boldface type. Each indicator is followed by activities which
illustrate how it can be addressed in the classroom in grades 9, 10,
11, and 12.
Building upon knowledge and skills gained in the preceding grades,
experiences in grades 9-12 will be such that all students:
14. Model and solve problems that involve varying
quantities using variables, expressions, equations,
inequalities, absolute values, vectors, and matrices.
- Students take data involving two variables in an area of
interest to them from the World Almanac, construct a scatterplot, and
predict the type of equation or function which would best model the
data. They use a computerized statistics package or a calculator to
fit a function of this type to the data. They choose from linear,
quadratic, exponential or logarithmic methods and discuss how well the
model fits as well as the limitations.
- Students use matrices to represent tabular information such
as the print runs below for each of two presses owned by a book
company. They then calculate a third matrix that indicates the growth
in production of each press from 1987 to 1988 and discuss the meaning
of the data contained in it.
| 1988 |
Textbooks |
Novels |
Nonfiction |
| Press 1 |
250,000 |
125,000 |
312,000 |
| Press 2 |
60,000 |
48,000 |
90,000 |
| 1987 |
Textbooks |
Novels |
Nonfiction |
| Press 1 |
190,000 |
100,000 |
140,000 |
| Press 2 |
45,000 |
60,000 |
72,000 |
Some students perform the operations by hand while others explain
how they would do it and then use their graphing calculator or a
spreadsheet, or write a computer program, which accomplishes the
task.
- Students use vectors to determine the path of a plane that
was flying due north at 300 miles per hour while a wind was blowing
from the southwest at a speed of 15 miles per hour. Students draw a
diagram and use an algebraic approach.
- Students work in groups on the following HSPT-like
problem from the Mathematics Instructional Guide
published by the New Jersey State Department of Education:
As you ride home from a football game, the number of kilometers
you are away from home depends (largely) on the number of
minutes you have been riding. Suppose that you are 13 km from
home when you have been riding for 10 minutes, and 8 km from home when
you have been riding for 15 minutes. (Assume that the distance
varies linearly with time.) Make a graph with the vertical axis
representing distance home and the horizontal axis representing
time. Label your graph. Plot the data given as two points on your
graph. About how long did it take (on average) to travel 1
km? About how far was the football game from your home?
Explain your answer.
- Students work through the Breaking the Mold lesson
that is described in the Introduction to this Framework. They
use a science experiment involving growing a mold to learn about
exponential growth of populations and compound interest.
- Students work through the What's My
Line unit that is described in the Keys to Success chapter of this
Framework. In this unit, students find a linear relationship
between the length of a person's thigh bone and his height, and
use this to estimate the height of a person whose thigh bone has been
found.
- Students work through the Ice Cones lesson that is
described in the First Four Standards of this Framework. In
this lesson, an ice-cream vendor's problem of folding a circle
into a cone of maximum volume is solved by expressing the volume as a
function which is then displayed on an graphing calculator.
15. Use tables and graphs as tools to
interpret expressions, equations, and inequalities.
- On a test, students are asked to determine the truth
value of the statement "log x > 0 for all positive real
numbers x." One student remembers that log x is the exponent to
which 10 must be raised to get x, and to get a number less than 1
would require a negative exponent. Another student picks some trial
points, develops a chart of the points and their logarithms and
discovers that when x < 1, log x < 0. A third student graphs
the function on his graphing calculator and sees that when x < 1,
the graph of log x is below the xaxis.
- Faced with the problem of solving the inequality
x2 3x < 4, some students use the equation
x2 3x 4 = 0 to determine the boundary points of the
interval that satisfies the inequality. They factor the equation and
find that these endpoints are 1 and 4. They place dots on the number
line at those points, since they know the endpoints are included in
the solution set, and then substitute 0 for x in the original
inequality. When they find that the resulting statement is true, they
shade the interval connecting the two points to obtain their solution
-1 < x < 4. Some students determine the endpoints in the
same way but roughly sketch a graph of the parabola y =x2
- 3 x - 4 and determine that since the inequality was < , the
problem was asking when the parabola was below the xaxis. Their graph
indicates that this happens in the region between the two endpoints.
Other students used their graphing calculators to graph the function
x2 3x and used the trace function to determine when the
graph was on or below the line y=4. All students, however, are able
to use all these methods to solve the problem.
16. Develop, explain, use, and analyze procedures for
operating on algebraic expressions and matrices.
- Students use algebra tiles to develop procedures for
multiplying binomials and factoring trinomials. They summarize these
procedures in their math notebooks, applying them to the solution of
real-world problems. They work through the Making Rectangles
lesson described in the First Four Standards of this Framework,
where they discuss which combinations of tiles can be formed into
rectangles, and relate this question to factoring trinomials.
- Students work in groups on the following
HSPT-like problem from the Mathematics Instructional
Guide (p. 7-153) published by the New Jersey State Department of
Education:
Which of the following is NOT another name for 1?
- After many experiences with trying to determine appropriate
windows for graphing functions on computers or graphing calculators,
students develop an understanding of the need to know what the general
behavior of a function will be before they use the technology.
Students are then asked to explain how they could determine the
behavior of the graph of the function below.
Students factor the numerator and denominator to determine the
values which make them zero and use those values to identify the
xintercepts and vertical asymptotes, respectively. They discuss the
fact that the factors x and x+6 appear in both
places and lead to a removable discontinuity represented by a hole in
the graph. They discuss the end behavior of the function as
approaching y = 1 and the behavior near the vertical
asymptote of x = 6.
- Following a unit on combinations and binomial expansion,
students make a journal entry discussing the power of Pascal's
triangle in expanding powers of binomial expressions as compared to
the traditional multiplication algorithm.
17. Solve equations and inequalities of varying
degrees using graphing calculators and computers as well as
appropriate paperandpencil techniques.
- Students are asked to find the solutions to 2x =
3x2. Some students use a spreadsheet to develop a table of
values. Once they find an interval of length 1 which contains a
solution, they refine their numbers to develop the answer to the
desired precision. Otherstudents graph both y = 2x and
y = 3x2 using graphing calculators or computers and use
the trace function to determine where they intersect. Other students
graph the function y = 3 x2 - 2x and use
the trace function to find the zeroes. Other students enter the
function in their graphing calculator and check the table of
values.
- As a portion of a final assessment, students are given one
opportunity to place a cup which is supported 6 inches off the ground
in such a position as to catch a marble rolled down a ramp. They
perform the roll without the cup to locate the point where the marble
strikes the ground. They measure the height of the end of the ramp
above the ground and the distance from the point on the ground
directly beneath the end of the ramp to the point where the marble
struck the ground. They generate the quadratic function which models
the path of the marble. Several students use different methods to
ensure they have the correct function. Then they decide where they
will have to place the cup by substituting 6 for the function value
and determining the corresponding xvalue. Students solve the equation
using the quadratic formula, and the trace function on a graphing
calculator, and proceed to place the cup and roll the ball only when
the solutions produced by all of the methods agree.
18. Understand the logic and purposes of algebraic
procedures.
- Students use matrices as arrays of information, so that
the matrix below, for example, is recognized as representing the four
vertices {(1,4), (5,6), (3, - 2), (- 2, - 2)} of a
polygon. Reducing the polygon by 1/2 can then be represented by
multiplying the matrix by the scalar 1/2 and moving the polygon to
the right one unit can be represented by adding to it a 2 x 4 matrix
whose top row consists of 1s and its bottom row of 0s.
- Students read Mathematics in the Time of the
Pharaohs by Richard Gillings to understand the development of
Egyptian mathematics including computational procedures for dealing
with direct and inverse proportions, linear equations, and
trigonometric functions.
- Students explain in their journals how the identity matrix
is like the number one.
19. Interpret algebraic equations and inequalities
geometrically, and describe geometric objects
algebraically.
References
-
Gillings, Richard. Mathematics in the Time of the
Pharoahs.
New Jersey State Department of Education. Mathematics
Instructional Guide. D. Varygiannes, Coord. Trenton:
1996.
Software
-
Green Globs and Graphing Equations.
Sunburst Communications.
On-Line Resources
-
http://dimacs.rutgers.edu/archive/nj_math_coalition/framework.html/
The Framework will be available at this site during Spring
1997. In time, we hope to post additional resources relating to this
standard, such as grade-specific activities submitted by New Jersey
teachers, and to provide a forum to discuss the Mathematics
Standards.
|

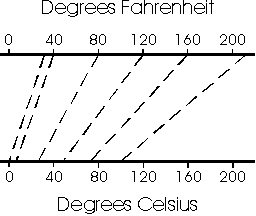 Students make a model of the relationship between
Celsius and Fahrenheit temperatures. They represent the relationship
as a formula, and check the formula against two known data points
- 0 degrees Centigrade = 32 degrees Fahrenheit and 100 degrees Centigrade = 212 degrees Fahrenheit. Students use
their formula to convert between Celsius and Fahrenheit
temperatures.
Students make a model of the relationship between
Celsius and Fahrenheit temperatures. They represent the relationship
as a formula, and check the formula against two known data points
- 0 degrees Centigrade = 32 degrees Fahrenheit and 100 degrees Centigrade = 212 degrees Fahrenheit. Students use
their formula to convert between Celsius and Fahrenheit
temperatures.