Standard 14 - DISCRETE MATHEMATICS
K-12 Overview
|
All students will apply the concepts and methods of discrete
mathematics to model and explore a variety of practical
situations.
|
Descriptive Statement
Discrete mathematics is the branch of mathematics that deals with
arrangements of distinct objects. It includes a wide variety of
topics and techniques that arise in everyday life, such as how to find
the best route from one city to another, where the objects are cities
arranged on a map. It also includes how to count the number of
different combinations of toppings for pizzas, how best to schedule a
list of tasks to be done, and how computers store and retrieve
arrangements of information on a screen. Discrete mathematics is the
mathematics used by decision-makers in our society, from workers in
government to those in health care, transportation, and
telecommunications. Its various applications help students see the
relevance of mathematics in the real world.
Meaning and Importance
During the past 30 years, discrete mathematics has grown rapidly
and has evolved into a significant area of mathematics. It is the
language of a large body of science and provides a framework for
decisions that individuals will need to make in their own lives, in
their professions, and in their roles as citizens. Its many practical
applications can help students see the relevance of mathematics to the
real world. It does not have extensive prerequisites, yet it poses
challenges to all students. It is fun to do, is often geometry based,
and can stimulate an interest in mathematics on the part of students
at all levels and of all abilities.
K-12 Development and Emphases
Although the term "discrete mathematics" may seem
unfamiliar, many of its themes are already present in the classroom.
Whenever objects are counted, ordered, or listed, whenever
instructions are presented and followed, whenever games are played and
analyzed, teachers are introducing themes of discrete
mathematics. Through understanding these themes, teachers will be able
to recognize and introduce them regularly in classroom situations.
For example, when calling three students to work at the three segments
of the chalkboard, the teacher might ask In how many different
orders can these three students work at the board? Another
version of the same question is How many different ways, such as
ABC, can you name a triangle whose vertices are labeled A, B,
and C? A similar, but slightly different question is In how
many different orders can three numbers be multiplied?
Two important resources on discrete mathematics for teachers at all
levels are the 1991 NCTM YearbookDiscrete Mathematics Across the
Curriculum K-12 and the 1997 DIMACS Volume Discrete Mathematics
in the Schools: Making an Impact. The material in this
chapter is drawn from activities that have been reviewed and
classroom-tested by the K-12 teachers in the Rutgers University
Leadership Program in Discrete Mathematics over the past nine years;
this program is funded by the National Science Foundation.
Students should learn to recognize examples of discrete mathematics
in familiar settings, and explore and solve a variety of problems for
which discrete techniques have proved useful. These ideas should be
pursued throughout the school years. Students can start with many of
the basic ideas in concrete settings, including games and general
play, and progressively develop these ideas in more complicated
settings and more abstract forms. Five major themes of discrete
mathematics should be addressed at all K-12 grade levels -
systematic listing, counting, and reasoning; discrete mathematical
modeling using graphs (networks) and trees; iterative (that is,
repetitive) patterns and processes; organizing and processing
information; and following and devising lists of
instructions, called "algorithms," and using
algorithms to find the best solution to real-world
problems. These five themes are discussed in the paragraphs
below.
Students should use a variety of strategies to systematically
list and count the number of ways there are to complete a
particular task. For example, elementary school students should be
able to make a list of all possible outcomes of a simple situation
such as the number of outfits that can be worn using two coats and
three hats. Middle school students should be able to systematically
list and count the number of different four-block-high towers that can
be built using blue and red blocks (see example below), or the number
of possible routes from one location on a map to another, or the
number of different "words" that can be made using five
letters. High school students should be able to determine the number
of possible orderings of an arbitrary number of objects and to
describe procedures for listing and counting all such orderings. These
strategies for listing and counting should be applied by both middle
school and high school students to solve problems in probability.
Following is a list of all four-block-high towers that can be built
using clear blocks and solid blocks. The 16 towers are presented in a
systematic list - the first 8 towers have a clear block at the
bottom and the second 8 towers have a solid block at the bottom;
within each of these two groups, the first 4 towers have the second
block clear, and the second 4 towers have the second block solid;
etc.

If each tower is described alphabetically as a sequence of C's
and S's, representing "clear" and "solid"
- the tower at the left, for example, would be C-C-C-C, and the
third tower from the left would be
C-C-S-C, reading from the bottom up - then the sixteen towers
would be in alphabetical order:
C-C-C-C
C-C-C-S
C-C-S-C
C-C-S-S
|
C-S-C-C
C-S-C-S
C-S-S-C
C-S-S-S
|
S-C-C-C
S-C-C-S
S-C-S-C
S-C-S-S
|
S-S-C-C
S-S-C-S
S-S-S-C
S-S-S-S
|
There are other ways of systematically listing the 16 towers; for
example, the list could contain first the one tower with no solid
blocks, then the four towers with one solid block, then the six towers
with two solid blocks, then the four towers with three solid blocks,
and finally the one tower with four solid blocks.
Discrete mathematical models such as graphs (networks) and
trees (such as those pictured below) can be used to represent and
solve a variety of problems based on real-world situations.

In the left-most graph of the figures above, all seven dots are
linked into a network consisting of the six line segments emerging
from the center dot; these six line segments form the tree at the far
right which is said to "span" the original graph since it
reaches all of its points. Another example: if we think of the
second graph as a street map and we make the streets one way, we can
represent the situation using a directed graph where the line segments
are replaced by arrows.
Elementary school students should recognize that a street map can
be represented by a graph and that routes can be represented by paths
in the graph; middle school students should be able to find
cost-effective ways of linking sites into a network using spanning
trees; and high school students should be able to use efficient
methods to organize the performance of individual tasks in a larger
project using directed graphs.
Iterative patterns and processes are used both for
describing the world and in solving problems. An iterative pattern or
process is one which involves repeating a single step or sequence of
steps many times. For example, elementary school students should
understand that multiplication corresponds to repeatedly adding the
same number a specified number of times. They should investigate how
decorative floor tilings can often be described as the repeated use of
a small pattern, and how the patterns of rows in pine cones follow a
simple mathematical rule. Middle school students should explore how
simple repetitive rules can generate interesting patterns by using
spirolaterals or Logo commands, or how they can result in extremely
complex behavior by generating the beginning stages of fractal curves.
They should investigate the ways that the plane can be covered by
repeating patterns, called tessellations. High school students should
understand how many processes describing the change of physical,
biological, and economic systems over time can be modeled by simple
equations applied repetitively, and use these models to predict the
long-term behavior of such systems.
Students should explore different methods of arranging,
organizing, analyzing, transforming, and communicating
information, and understand how these methods are used in a
variety of settings. Elementary school students should investigate
ways to represent and classify data according to attributes such as
color or shape, and to organize data into structures like tables or
tree diagrams or Venn diagrams. Middle school students should be able
to read, construct, and analyze tables, matrices, maps and other data
structures. High school students should understand the application of
discrete methods to problems of information processing and computing
such as sorting, codes, and error correction.
Students should be able to follow and devise lists of
instructions, called "algorithms," and use
them to find the best solution to real-world problems
- where "best" may be defined, for example, as most
cost-effective or as most equitable. For example, elementary school
students should be able to carry out instructions for getting from one
location to another, should discuss different ways of dividing a pile
of snacks, and should determine the shortest path from one site to
another on a map laid out on the classroom floor. Middle school
students should be able to plan an optimal route for a class trip (see
the vignette in the Introduction to this Framework entitled
Short-circuiting Trenton), write precise instructions for
adding two two-digit numbers, and, pretending to be the manager of a
fast-food restaurant, devise work schedules for employees which meet
specified conditions yet minimize the cost. High school students
should be conversant with fundamental strategies of optimization, be
able to use flow charts to describe algorithms, and recognize both the
power and limitations of computers in solving algorithmic
problems.
In summary, discrete mathematics is an exciting and
appropriate vehicle for working toward and achieving the goal of
educating informed citizens who are better able to function in our
increasingly technological society; have better reasoning power and
problem-solving skills; are aware of the importance of mathematics in
our society; and are prepared for future careers which will require
new and more sophisticated analytical and technical tools. It is an
excellent tool for improving reasoning and problem-solving
abilities.
Note: Although each content standard is discussed
in a separate chapter, it is not the intention that each be
treated separately in the classroom. Indeed, as noted in the
Introduction to this Framework, an effective curriculum is one
that successfully integrates these areas to present students with rich
and meaningful cross-strand experiences.
References
-
Kenny, M. J., Ed. Discrete Mathematics Across the Curriculum
K-12. 1991 Yearbook of the National Council of Teachers of
Mathematics (NCTM). Reston, VA, 1991.
Rosenstein, J. G., D. Franzblau, and F. Roberts, Eds.
Discrete Mathematics in the Schools:
Making an Impact. Proceedings of a 1992 DIMACS Conference
on "Discrete Mathematics in the Schools." DIMACS Series
on Discrete Mathematics and Theoretical Computer Science.
Providence, RI: American Mathematical Society (AMS), 1997.
(Available online from this chapter in
http://dimacs.rutgers.edu/archive/nj_math_coalition/framework.html/.)
Standard 14 - Discrete Mathematics - Grades K-2
Overview
The five major themes of discrete mathematics, as discussed in the
K-12 Overview, are systematic listing, counting, and
reasoning; discrete mathematical modeling using graphs (networks) and
trees; iterative (that is, repetitive) patterns and processes;
organizing and processing information; and following and
devising lists of instructions, called
"algorithms," and using them to find the best
solution to real-world problems.
Despite their formidable titles, these five themes can be addressed
with activities at the K-2 grade level which involve purposeful play
and simple analysis. Indeed, teachers will discover that many
activities they already are using in their classrooms reflect these
themes. These five themes are discussed in the paragraphs below.
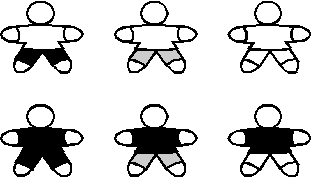 Activities involving systematic listing, counting, and
reasoning can be done very concretely at the K-2 grade level. For
example, dressing cardboard teddy bears with different outfits becomes
a mathematical activity when the task is to make a list of all
possible outfits and count them; pictured on the right are the six
outfits that can be arranged using one of two types of shirts and one
of three types of shorts. Similarly, playing any game involving
choices becomes a mathematical activity when children reflect on the
moves they make in the game.
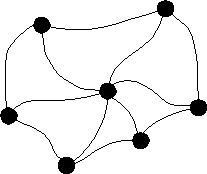 An important discrete mathematical model is that of a
network or graph, which consists of dots and lines
joining the dots; the dots are often called vertices (vertex is
the singular) and the lines are often called edges. (This is
different from other mathematical uses of the term "graph.")
The two terms "network" and "graph" are used
interchangeably for this concept. An example of a graph with seven
vertices and twelve edges is given below. You can think of the
vertices of this graph as islands in a river and the edges as
bridges. You can also think of them as buildings and roads,
or houses and telephone cables, or people and handshakes; wherever a
collection of things are joined by connectors, the mathematical model
used is that of a network or graph. At the K-2 level, children can
recognize graphs and use life-size models of graphs in various ways.
For example, a large version of this graph, or any other graph, can be
"drawn" on the floor using paper plates as vertices and
masking tape as edges. Children might select two "islands"
and find a way to go from one island to the other island by crossing
exactly four "bridges." (This can be done for any two
islands in this graph, but not necessarily in another graph.)
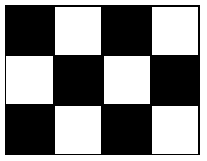 Children can recognize and work with repetitive patterns
and processes involving numbers and shapes, using objects
in the classroom and in the world around them. For example, children
at the K-2 level can create (and decorate) a pattern of triangles or
squares (as pictured here) that cover a section of the floor (this is
called a "tessellation"), or start with a number and
repeatedly add three, or use clapping and movement to simulate
rhythmic patterns.
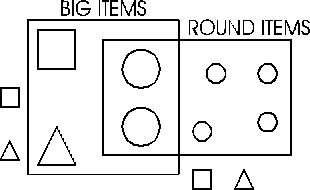 Children at the K-2 grade levels should investigate ways of
sorting items according to attributes like color, shape,
or size, and ways of arranging data into charts, tables, and
family trees. For example, they can sort attribute blocks or stuffed
animals by color or kind, as in the diagram, and can count the number
of children who have birthdays in each month by organizing themselves
into birthday-month groups.
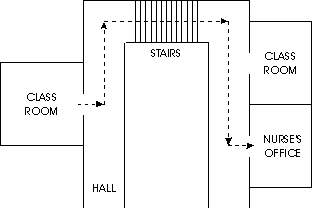
Finally, at the K-2 grade levels, children should be able to
follow and describe simple procedures and determine and discuss
what is the best solution to a problem. For example, they
should be able to follow a prescribed route from the classroom to
another room in the school (as pictured below) and to compare various
alternate routes, and in the second grade should determine the
shortest path from one site to another on a map laid out on the
classroom floor.
Two important resources on discrete mathematics for teachers at all
levels are the 1991 NCTM Yearbook Discrete Mathematics Across the
Curriculum K-12 and the 1997 DIMACS Volume Discrete Mathematics
in the Schools: Making An Impact. Another important
resource for K-2 teachers is This Is MEGA-Mathematics!
Standard 14 - Discrete Mathematics - Grades K-2
Indicators and Activities
The cumulative progress indicators for grade 4 appear below in
boldface type. Each indicator is followed by activities which
illustrate how it can be addressed in the classroom in kindergarten
and grades 1 and 2.
Experiences will be such that all students in grades K-2:
1. Explore a variety of puzzles, games, and
counting problems.
- Students use teddy bear cutouts with, for example, shirts
of two colors and shorts of three colors, and decide how many
different outfits can be made by making a list of all possibilities
and arranging them systematically. (See illustration in K-2
Overview.)
- Students use paper faces or Mr. Potato Head type
models to create a "regular face" given a nose, mouth, and a
pair of eyes. Then they use another pair of eyes, then another nose,
and then another mouth (or other parts) and explore and record the
number of faces that can be made after each additional part has been
included.
- Students read A Three Hat Day and then
try to create as many different hats as possible with three hats, a
feather, a flower, and a ribbon as decoration. Students count the
different hats they've made and discuss their
answers.
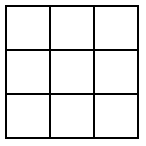
- Students count the number of squares of each
size (1 x 1, 2 x 2, 3 x 3) that they can find on the square grid
below. They can be challenged to find the numbers of small squares of
each size on a larger square or rectangular grid.
- Students work in groups to figure out the rules of addition
and placement that are used to pass from one row to the next in the
diagram below, and use these rules to find the numbers in the next few
rows.
1
1 1
1 2 1
1 3 3 1
1 4 6 4 1
In this diagram, called Pascal's triangle, each number is the
sum of the two numbers that are above it, to its left and right; the
numbers on the left and right edges are all 1.
- Students cut out five "coins" labeled 1 cent,
2 cents, 4 cents, 8 cents, and 16 cents. For each number in the
counting sequence 1, 2, 3, 4, 5, ... (as far as is appropriate for a
particular group ofstudents), students determine how to obtain that
amount of money using a combination of different coins.
- Students play simple games and discuss why they make the
moves they do. For example, two students divide a six-piece domino
set (with 0-0, 0-1, 0-2, 1-1, 1-2, and 2-2) and take turns placing
dominoes so that dominoes which touch have the same numbers and so
that all six dominoes are used in the chain.
2. Use networks and tree diagrams to represent
everyday situations.
- Students find a way of getting from one island
to another, in the graph described in the K-2 Overview laid out on the
classroom floor with masking tape, by crossing exactly four bridges.
They make their own graphs, naming each of the islands, and make a
"from-to" list of islands for which they have found a
four-bridge-route. (Note: it may not always be possible to find
four-bridge-routes.)
- Students count the number of edges at each
vertex (called the degree of the vertex) of a network and
construct graphs where all vertices have the same degree, or where all
the vertices have one of two specified degrees.
-
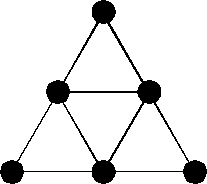 On a pattern of islands and bridges laid out on the
floor, students try to find a way of visiting each island exactly
once; they can leave colored markers to keep track of islands already
visited. Note that for some patterns this may not be possible!
Students can be challenged to find a way of visiting each island
exactly once which returns them to their starting point. Similar
activities can be found in Inside, Outside, Loops, and
Lines by Herbert Kohl.
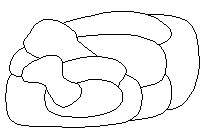
- Students create a map with make-believe
countries (see example below), and color the maps so that countries
which are next to each other have different colors. How many
colors were used? Could it be done with fewer colors? with
four colors? with three colors? with two colors? A
number of interesting map coloring ideas can be found in Inside,
Outside, Loops and Lines by Herbert Kohl.
3. Identify and investigate sequences and patterns
found in nature, art, and music.
- Students use a calculator to create a sequence of
ten numbers starting with zero, each of which is three more than the
previous one; on some calculators, this can be done bypressing 0 + 3 =
= = . . . , where = is pressed ten times. As they proceed, they count
one 3, two 3s, three 3s, etc.
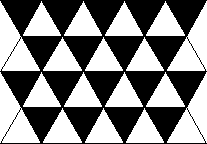 Students "tessellate" the plane, by using
groups of squares or triangles (for example, from sets of pattern
blocks) to completely cover a sheet of paper without overlapping; they
record their patterns by tracing around the blocks on a sheet of paper
and coloring the shapes.
Students "tessellate" the plane, by using
groups of squares or triangles (for example, from sets of pattern
blocks) to completely cover a sheet of paper without overlapping; they
record their patterns by tracing around the blocks on a sheet of paper
and coloring the shapes.- Students listen to or read Grandfather
Tang's Story by Ann Tompert and then use tangrams to
make the shape-changing fox fairies as the story progresses. Students
are then encouraged to do a retelling of the story with tangrams or to
invent their own tangram characters and stories.
- Students read The Cat in the Hat or
Green Eggs and Ham by Dr. Seuss and identify the pattern of
events in the book. Students could create their own books with
similar patterns.
- Students collect leaves and note the patterns of the veins.
They look at how the veins branch off on each side of the center vein
and observe that their branches are smaller copies of the original
vein pattern. Students collect feathers, ferns, Queen Anne's
lace, broccoli, or cauliflower and note in each case how the pattern
of the original is repeated in miniature in each of its branches or
clusters.
- Students listen for rhythmic patterns in musical selections
and use clapping, instruments, and movement to simulate those
patterns.
- Students take a "patterns walk"
through the school, searching for patterns in the bricks, the play
equipment, the shapes in the classrooms, the number sequences of
classrooms, the floors and ceilings, etc.; the purpose of this
activity is to create an awareness of all the patterns around
them.
4. Investigate ways to represent and classify data
according to attributes, such as shape or color, and
relationships, and discuss the purpose and usefulness of such
classification.
- Students sort themselves by month of birth, and then within
each group by height or birth date. (Other sorting activities can be
found in Mathematics Their Way, by Mary Baratta-Lorton.)
- Each student is given a card with a different number on it.
Students line up in a row and put the numbers in numerical order by
exchanging cards, one at a time, with adjacent children. (After
practice, this can be accomplished without talking.)
- Students draw stick figures of members of their
family and arrange them in order of size.
- Students sort stuffed animals in various ways and explain
why they sorted them as they did. Students can use Tabletop,
Jr. software to sort characters according to a variety of
attributes.
- Using attribute blocks, buttons, or other objects with
clearly distinguishable attributes such as color, size, and shape,
students develop a sequence of objects where each differs from the
previous one in only one attribute. Tabletop, Jr. software can
also be used to create such sequences of objects.
- Students use two Hula Hoops (or large circles drawn on
paper so that a part of their interiors overlap) to assist in sorting
attribute blocks or other objects according to two characteristics.
For example, given a collection of objects of different colors and
shapes, students are asked to place them so that all red items go
inside hoop #1 and all others go on the outside, and so that all
square items go inside hoop #2 and all others go on the outside.
What items should be placed in the overlap of the two hoops? What
is inside only the first hoop? What is outside both
hoops?
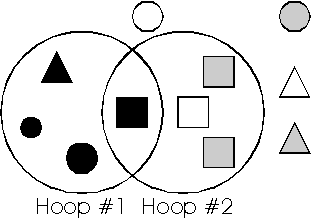
This is an example of a Venn diagram. Students can also use Venn
diagrams to organize the similarities and differences between the
information in two stories by placing all features of the first story
in hoop #1 and all features of the second story in hoop #2, with
common features in the overlap of the two hoops. A similar activity
can be found in the Shapetown lesson that is described in the
First Four Standards of this Framework. Tabletop, Jr.
software allows students to arrange and sort data, and to explore
these concepts easily.
5. Follow, devise, and describe practical lists of
instructions.
- Students follow directions for a trip within the classroom
- for example, students are asked where they would end up if they
started at a given spot facing in a certain direction, took three
steps forward, turned left, took two steps forward, turned right, and
moved forward three more steps.
- Students follow oral directions for going from the
classroom to the lunchroom, and represent these directions with a
diagram. (See K-2 Overview for a sample diagram.)
- Students agree on a procedure for filling a box with
rectangular blocks. For example, a box with dimensions
4"x4"x5" can be filled with 10 blocks of dimensions
1"x2"x4". (Linking cubes can be used to create the
rectangular blocks.)
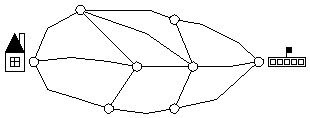
- Students explore the question of finding the shortest route
from school to home on a diagram like the one pictured below, laid out
on the floor using masking tape, where students place a number of
counters on each line segment to represent the length of that segment.
(The shortest route will depend on the placement of the counters; what
appears to be the most direct route may not be the shortest.)
- Students find a way through a simple maze. They
discuss the different paths they took and their reasons for doing
so.
- Students use Logo software to give the turtle
precise instructions for movement in specified
directions.
References
-
Baratta-Lorton, Mary. Mathematics Their Way. Menlo Park,
CA: Addison Wesley, 1993.
Casey, Nancy, and Mike Fellows. This is MEGA-Mathematics!
- Stories and Activities for
Mathematical Thinking, Problem-Solving, and Communication.
Los Alamos, CA: Los Alamos National Laboratories, 1993. (A
version is available online at
http://www.c3.lanl.gov/mega-math)
Geringer, Laura. A Three Hat Day. New York: Harper Row
Junior Books, 1987.
Kenney, M. J., Ed. Discrete Mathematics Across the Curriculum
K-12. 1991 Yearbook of the National Council of Teachers of
Mathematics (NCTM). Reston, VA: 1991.
Kohl, Herbert. Insides, Outsides, Loops, and Lines. New
York: W. H. Freeman, 1995.
Murphy, Pat. By Nature's Design. San
Francisco, CA: Chronicle Books, 1993.
Rosenstein, J. G., D. Franzblau, and F. Roberts, Eds.
Discrete Mathematics in the Schools:
Making an Impact. Proceedings of a 1992 DIMACS Conference
on "Discrete Mathematics in the Schools." DIMACS Series
on Discrete Mathematics and Theoretical Computer Science.
Providence, RI: American Mathematical Society (AMS), 1997.
(Available online from this chapter in
http://dimacs.rutgers.edu/archive/nj_math_coalition/framework.html/.)
Seuss, Dr. Cat in the Hat. Boston, MA: Houghton
Mifflin, 1957.
Seuss, Dr. Green Eggs and Ham. Random House.
Tompert, Ann. Grandfather Tang's Story.
Crown Publishing, 1990.
Software
-
Logo. Many versions of Logo are commercially
available.
Tabletop, Jr. Broderbund Software. TERC.
On-Line Resources
-
http://dimacs.rutgers.edu/archive/nj_math_coalition/framework.html/
The Framework will be available at this site during
Spring 1997. In time, we hope to post additional resources
relating to this standard, such as grade-specific activities submitted
by New Jersey teachers, and to provide a forum to discuss the
Mathematics Standards.
Standard 14 - Discrete Mathematics - Grades 3-4
Overview
The five major themes of discrete mathematics, as discussed in the
K-12 Overview, are systematic listing, counting, and
reasoning; discrete mathematical modeling using graphs (networks) and
trees; iterative (that is, repetitive) patterns and processes;
organizing and processing information; and following and
devising lists of instructions, called
"algorithms," and using them to find the best
solution to real-world problems.
Despite their formidable titles, these five themes can be addressed
with activities at the 3-4 grade level which involve purposeful play
and simple analysis. Indeed, teachers will discover that many
activities that they already are using in their classrooms reflect
these themes. These five themes are discussed in the paragraphs
below.
The following discussion of activities at the 3-4 grade levels
in discrete mathematics presupposes that corresponding
activities have taken place at the K-2 grade levels. Hence 3-4 grade
teachers should review the K-2 grade level discussion of
discrete mathematics and use might use activities similar to those
described there before introducing the activities for this
grade level.
Activities involving systematic listing, counting, and
reasoning should be done very concretely at the 3-4 grade levels,
building on similar activities at the K-2 grade levels. For example,
the children could systematically list and count the total number of
possible combinations of dessert and beverage that can be selected
from pictures of those two types of foods they have cut out of
magazines or that can be selected from a restaurant menu. Similarly,
playing games like Nim, dots and boxes, and dominoes becomes a
mathematical activity when children systematically reflect on the
moves they make in the game and use those reflections to decide on the
next move.
An important discrete mathematical model is that of a
graph, which is used whenever a collection of things are joined
by connectors - such as buildings and roads, islands and bridges,
or houses and telephone cables - or, more abstractly, whenever
the objects have some defined relationship to each other; this kind of
model is described in the K-2 Overview. At the 3-4 grade levels,
children can recognize and use models of graphs in various ways, for
example, by finding a way to get from one island to another by
crossing exactly four bridges, or by finding a route for a city mail
carrier which uses each street once, or by constructing a
collaboration graph for the class which describes who has worked with
whom during the past week. A special kind of graph is called a
"tree." Three views of the same tree are pictured in the
diagram below; the first suggests a family tree, the second a tree
diagram, and the third a "real" tree.

At the 3-4 grade levels, students can use a tree diagram to
organize the six ways that three people can bearranged in order. (See
the Grades 3-4 Indicators and Activities for an example.)
Students can recognize and work with repetitive patterns and
processes involving numbers and shapes, with classroom objects and
in the world around them. Children at the 3-4 grade levels are
fascinated with the Fibonacci sequence of numbers 1, 1, 2, 3, 5, 8,
13, 21, 34, 55, 89, ... where every number is the sum of the previous
two numbers. This sequence of numbers turns up in petals of flowers,
in the growth of populations (see the activity involving rabbits), in
pineapples and pine cones, and in lots of other places in nature.
Another important sequence to introduce at this age is the doubling
sequence 1, 2, 4, 8, 16, 32, ... and to discuss different situations
in which it appears.
Students at the 3-4 grade levels should investigate ways of
sorting items according to attributes like color or
shape, or by quantitative information like size, arranging data
using tree diagrams and building charts and tables, and recovering
hidden information in games and encoded messages. For example,
they can sort letters into zip code order or sort the class
alphabetically, create bar charts based on information obtained
experimentally (such as soda drink preferences of the class), and play
games like hangman to discover hidden messages.
Students at the 3-4 grade levels should describe and discuss
simple algorithmic procedures such as providing and following
directions from one location to another, and should in simple cases
determine and discuss what is the best solution to a problem.
For example, they might follow a recipe to make a cake or to assemble
a simple toy from its component parts. Or they might find the best
way of playing tic-tac-toe or the shortest route that can be used to
get from one location to another.
Two important resources on discrete mathematics for teachers at all
levels are the 1991 NCTM Yearbook Discrete Mathematics Across the
Curriculum K-12 and the 1997 DIMACS Volume Discrete Mathematics
in the Schools: Making An Impact. Another important
resource for 3-4 teachers is This Is MEGA-Mathematics!
Standard 14 - Discrete Mathematics - Grades 3-4
Indicators and Activities
The cumulative progress indicators for grade 4 appear below in
boldface type. Each indicator is followed by activities which
illustrate how it can be addressed in the classroom in grades 3 and
4.
Building upon knowledge and skills gained in the preceding grades,
experiences will be such that all students in grades 3-4:
1. Explore a variety of puzzles, games, and
counting problems.
- Students read One Hundred Hungry Ants by
Elinor Pinczes and then illustrate and write their own story books
(perhaps titled 18 Ailing Alligators or 24 Furry
Ferrets) in a style similar to the book using as many different
arrangements of the animals as possible in creating their books. They
read their books to students in the lower grades.
- Students count the number of squares of each
size (1x1, 2x2, 3x3, 4x4, 5x5) that they can find on a geoboard, and
in larger square or rectangular grids.
- Students determine the number of possible combinations of
dessert and beverage that could be selected from pictures of those two
types of foods they have cut out of magazines. Subsequently, they
determine the number of possible combinations of dessert and beverage
that could be chosen from a restaurant menu, and how many of those
combinations could be ordered if they only have $4.
- Students find the number of different ways to make a row of
four flowers each of which could be red or yellow. They can model
this with Unfix cubes and explain how they know that all combinations
have been obtained.
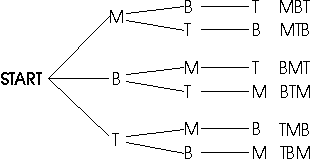
- Students determine the number of different ways any three
people can be arranged in order, and use a tree diagram to organize
the information. The tree diagram below represents the six ways that
Barbara (B), Maria (M), and Tarvanda (T), can be arranged in order.
The three branches emerging from the "start" position
represent the three people who could be first; each path from left to
right represents the arrangement of the three people listed to the
right.
- Each student uses four squares to make designs where each
square shares an entire side with at least one of the other three
squares. Geoboards, attribute blocks or Linker cubescan be used.
How many different shapes can be made? These shapes are called
"tetrominoes."
- Each group of students receives a bag containing four
colored beads. One group may be given 1 red, 1 black and 2 green
beads; other groups may have the same four beads or different ones.
Students take turns drawing a bead from the bag, recording its color,
and replacing it in the bag. After 20 beads are drawn, each group
makes a bar graph illustrating the number of beads drawn of each
color. They make another bar graph illustrating the number of beads
of each color actually in the bag, and compare the two bar graphs. As
a follow-up activity, students should draw 20 or more times from a bag
containing an unknown mixture of beads and try to guess, and justify,
how many beads of each color are in the container.
- Students determine what amounts of postage can and cannot
be made using only 3 cent and 5 cent stamps.
- Students generate additional rows of Pascal's
triangle (at right). They color all odd entries one color and all
even entries another color. They examine the patterns that result,
and try to explain what they see. They discuss whether their
conclusions apply to a larger version of Pascal's triangle.
1
1 1
1 2 1
1 3 3 1
1 4 6 4 1
- Students make a table indicating which stamps of the
denominations 1 cent, 2 cents, 4 cents, 8 cents, 16 cents, 32 cents
would be used (with no repeats) to obtain each amount of postage from
1 cent to 63 cent. For the table, they list the available
denominations across the top and the postage amounts from 1 cent to
63 cents at the left; they put a checkmark in the appropriate spot if
they need the stamp for that amount, and leave it blank otherwise.
They try to find a pattern which could be used to decide which amounts
of postage could be made if additional stamps (like 64 cents and
128 cents) were used.
- Students play games like Nim and reflect on the moves they
make in the game. (See Math for Girls and Other Problem
Solvers, by D. Downie et al., for other games for this grade
level.) In Nim, you start with a number of piles of objects -
for example, you could start with two piles, one with five buttons,
the other with seven buttons. Two students alternate moves, and each
move consists of taking some or all of the buttons from a single pile;
the child who takes the last button off the table wins the game. Once
they master this game, students can try Nim with three piles, starting
with three piles which have respectively 1, 2, and 3 buttons.
- Students play games like dots and boxes
and systematically think about the moves they make in the game.
In dots and boxes, you start with a square (or rectangular) array of
dots, and two students alternate drawing a line which joins two
adjacent dots. Whenever all four sides of a square have been drawn,
the student puts her or his initial in the square and draws another
line; the person with initials in more squares wins the
game.
2. Use networks and tree diagrams to represent
everyday situations.
- Students make a collaboration graph for the members of the
class which describes who has worked with whom during the past
week.
- Students draw specified patterns on the chalkboard without
retracing, such as those below. Alternatively, they may trace these
patterns in a small box of sand, as done historically in African
cultures. (See Ethnomathematics, Drawing Pictures With One
Line, or Insides, Outsides, Loops, and Lines.)
Alternatively, on a pattern of islands and bridges laid out on the
floor with masking tape, students might try to take a walk which
involves crossing each bridge exactly once (leaving colored markers on
bridges already crossed); note that for some patterns this may not be
possible. The patterns given here can be used, but students can
develop their own patterns and try to take such a walk for each
pattern that they create.
-
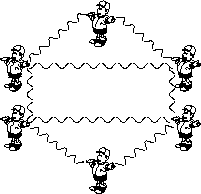 Students create "human graphs" where
they themselves are the vertices and they use pieces of yarn (several
feet long) as edges; each piece of yarn is held by two students, one
at each end. They might create graphs with specified properties; for
example, they might create a human graph with four vertices of degree
2, or, as in the figure at the right, with six vertices of which four
have degree 3 and two have degree 2. (The degree of a vertex is
the total number of edges that meet at the vertex.) They might count
the number of different shapes of human graphs they can form with four
students (or five, or six).
- Students use a floor plan of their school to map out
alternate routes from their classroom to the school's exits, and
discuss whether the fire drill route is in fact the shortest route to
an exit.
- Students draw graphs of their own neighborhoods, with
edges representing streets and vertices representing locations where
roads meet. Can you find a route for the mail carrier in
your neighborhood which enables her to walk down each street, without
repeating any streets, and which ends where it begins? Can you
find such a route if she needs to walk up and down each street
in order to deliver mail on both sides of the street?
- Students color maps (e.g., the 21 counties of New Jersey)
so that adjacent counties (or countries) have different colors, using
as few colors as possible. The class could then share a NJ cake
frosted accordingly. (See The Mathematician's Coloring
Book.)
- Students recognize and understand family trees in social
and historical studies, and instories that they read. Where
appropriate, they create their own family trees.
3. Identify and investigate sequences and patterns found
in nature, art, and music.
- Students read A Cloak for a Dreamer by
A. Friedman, and make outlines of cloaks or coats like those worn by
the sons of the tailor in the book by tracing their upper bodies on
large pieces of paper. Students could use pattern blocks or pre-cut
geometric shapes to cover (tessellate) the paper cloaks with patterns
like those in the book or try to make their own cloth
designs.
- Students read Sam and the Blue Ribbon
Quilt by Lisa Ernst, and by rotating, flipping, or sliding cut-out
squares, rectangles, triangles, etc., create their own symmetrical
designs on quilt squares similar to those found in the book. The
designs from all the members of the class are put together to make a
patchwork class quilt or to form the frame for a math bulletin
board.
- Students take a "pattern walk" through
the neighborhood, searching for patterns in the trees, the houses, the
buildings, the manhole covers (by the way, why are they always
round?), the cars, etc.; the purpose of this activity is to
create an awareness of the patterns around us. By
Nature's Design is a photographic journey with an eye
for many of these natural patterns.
-
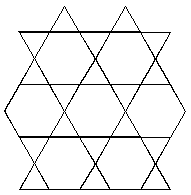 Students "tessellate" the plane using
squares, triangles, or hexagons to completely cover a sheet of paper
without overlapping. They also tessellate the plane using groups of
shapes, like hexagons and triangles as in the figure at the
right.
- Students might ask if their parents would be willing to
give them a penny for the first time they do a particular chore, two
pennies for the second time they do the chore, four pennies for the
third time, eight pennies for the fourth time, and so on. Before
asking, they should investigate, perhaps using towers of Unifix cubes
that keep doubling in height, how long their parents could actually
afford to pay them for doing the chore.
- Students cut a sheet of paper into two halves,
cut the resulting two pieces into halves, cut the resulting four
pieces into halves, etc. If they do this a number of times, say
12 times, and stacked all the pieces of paper on top of each
other, how high would the pile of paper be? Students
estimate the height before performing any calculations.
- Students color half a large square, then half of the
remaining portion with another color, then half of the remaining
portion with a third color, etc. Will the entire area ever get
colored? Why, or why not?
- Students count the number of rows of bracts on a
pineapple or pine cone, or rows of petals on an artichoke, or rows of
seeds on a sunflower, and verify that these numbers all appear in the
sequence 1, 1, 2, 3, 5, 8, 13, 21, 34, ... of Fibonacci numbers, where
each number is the sum of the two previous numbers on the list.
Students find other pictures depicting Fibonacci numbers as they arise
in nature, referring, for example, to Fibonacci Numbersin
Nature. In Mathematical Mystery Tour by Mark Wahl, an
elementary school teacher provides a year's worth of Fibonacci
explorations and activities.
- Using a large equilateral triangle provided by
the teacher, students find and connect the approximate midpoints of
the three sides, and then color the triangle in the middle. (See
Stage 1 picture.) They then repeat this procedure with each of the
three uncolored triangles to get the Stage 2 picture, and then repeat
this procedure again with each of the nine uncolored triangles to get
the Stage 3 picture. These are the first three stages of the
Sierpinski triangle; subsequent stages become increasingly intricate.
How many uncolored triangles are there in the Stage 3
picture? How many would there be in the Stage 4 picture if the
procedure were repeated again?

4. Investigate ways to represent and classify
data according to attributes, such as shape or color, and
relationships, and discuss the purpose and usefulness of such
classification.
- Students are provided with a set of index cards on each of
which is written a word (or a number). Working in groups, students
put the cards in alphabetical (or numerical) order, explain the
methods they used to do this, and then compare the various methods
that were used.
- Students bring to class names of cities and
their zip codes where their relatives and friends live, paste these at
the appropriate locations on a map of the United States, and look for
patterns which might explain how zip codes are assigned. Then they
compare their conclusions with post office information to see whether
they are consistent with the way that zip codes actually are
assigned.
- Students send and decode messages in which each letter has
been replaced by the letter which follows it in the alphabet (or
occurs two letters later). Students explore other coding systems
described in Let's Investigate Codes and Sequences
by Marion Smoothey.
- Students collect information about the soft drinks they
prefer and discuss various ways of presenting the resulting
information, such as tables, bar graphs, and pie charts, displayed
both on paper and on a computer.
- Students play the game of Set in which
participants try to identify three cards from those on display which,
for each of four attributes (number, shape, color, and shading), all
share the attribute or are all different. Similar ideas can be
explored using Tabletop, Jr. software.
5. Follow, devise, and describe practical lists of
instructions.
- Students follow a recipe to make a cake or to assemble a
simple toy from its component parts, and then write their own versions
of those instructions.
- Students give written and oral directions for going from
the classroom to another room in the school, and represent these
directions with a diagram drawn approximately to scale.
- Students read Anno's Mysterious
Multiplying Jar by Mitsumasa Anno. During a second reading they
devise a method to record and keep track of the increasing number of
items in the book and predict how that number will continue to grow.
Each group explains its method to the class.
- Students write step-by-step directions for a simple task
like making a peanut butter and jelly sandwich, and follow them to
prove that they work.
- Students find and describe the shortest path from the
computer to the door or from one location in the school building to
another.
-
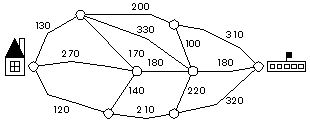 Students find the shortest route from school to home
on a map (see figure at right), where each edge has a specified
numerical length in meters; students modify lengths to obtain a
different shortest route.
- Students write a program which will create specified
pictures or patterns, such as a house or a clown face or a symmetrical
design. Logo software is well-suited to this activity. In Turtle
Math, students use Logo commands to go on a treasure hunt, and
look for the shortest route to complete the search.
- Working in groups, students create and explain a fair way of
sharing a bagful of similar candies or cookies. (See also the
vignette entitled Sharing A Snack in the Introduction to this
Framework.) For example, if the bag has 30 brownies and there
are 20 children, then they might suggest that each child gets one
whole brownie and that the teacher divide each of the remaining
brownies in half. Or they might suggest that each pair of children
figure out how to share one brownie. What if there were 30 hard
candies instead of brownies? What if there were 25 brownies?
What if there were 15 brownies and 15 chocolate chip cookies?
The purpose of this activity is for students to brainstorm
possible solutions in the situations where there may be no solution
that everyone perceives as fair.
- Students devise a strategy for never losing at
tic-tac-toe.
-
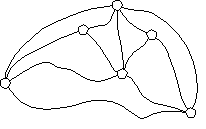 Students find different ways of paving just enough
streets of a "muddy city" (like the street map at the right,
perhaps laid out on the floor) so that a child can walk from any one
location to any other location along paved roadways. In "muddy
city" none of the roads are paved, so that whenever it rains all
streets turn to mud. The mayor has asked the class to propose
different ways of paving the roads so that a person can get from any
one location to any other location on paved roads, but so that the
fewest number of roads possible are paved.
- Students divide a collection of Cuisenaire rods of
different lengths into two or three groups whose total lengths are
equal (or as close to equal as possible).
References
-
Anno, M. Anno's Mysterious Multiplying Jar.
Philomel Books, 1983.
Asher, M. Ethnomathematics. Brooks/Cole Publishing
Company, 1991.
Casey, Nancy, and Mike Fellows. This is MEGA-Mathematics!
- Stories and Activities for
Mathematical Thinking, Problem-Solving, and Communication.
Los Alamos, CA: Los Alamos National Laboratories, 1993. (A
version is available online at
http://www.c3.lanl.gov/mega-math)
Chavey, Darrah. Drawing Pictures with One Line: Exploring
Graph Theory. Consortium for Mathematics and Its Applications
(COMAP), Module #21, 1992.
Downie, D., T. Slesnick, and J. Stenmark. Math for Girls and
Other Problem Solvers. EQUALS. Lawrence Hall of
Science, 1981.
Ernst, L. Sam Johnson and the Blue Ribbon Quilt.
Mulberry Paperback Book, 1992.
Francis, R. The Mathematician's Coloring
Book. Consortium for Mathematics and Its Applications
(COMAP), Module #13, 1989.
Fibonacci Numbers in Nature. Dale Seymour
Publications
Friedman, A. A Cloak for a Dreamer. Penguin Books.
Scholastics.
Kenney, M. J., Ed. Discrete Mathematics Across the Curriculum
K-12. 1991 Yearbook of the National Council of Teachers of
Mathematics (NCTM). Reston, VA: 1991.
Kohl, Herbert. Insides, Outsides, Loops, and Lines. New
York: W. H. Freeman, 1995.
Murphy, P. By Nature's Design. San
Francisco, CA: Chronicle Books, 1993.
Pinczes, E. J. One Hundred Hungry Ants. Houghton Mifflin
Company, 1993.
Rosenstein, J. G., D. Franzblau, and F. Roberts, Eds.
Discrete Mathematics in the Schools:
Making an Impact. Proceedings of a 1992 DIMACS Conference
on "Discrete Mathematics in the Schools." DIMACS Series
on Discrete Mathematics and Theoretical Computer Science.
Providence, RI: American Mathematical Society (AMS), 1997.
(Available online from this chapter in
http://dimacs.rutgers.edu/archive/nj_math_coalition/framework.html/.)
Set. Set Enterprises.
Smoothey, Marion. Let's Investigate Codes and
Sequences. New York: Marshall Cavendish Corporation,
1995.
Tompert, Ann. Grandfather Tang's Story.
Crown Publishing, 1990.
Wahl, Mark. Mathematical Mystery Tour: Higher-Thinking Math
Tasks. Tucson, AZ: Zephyr Press, 1988.
Software
-
Logo. Many versions of Logo are commercially
available.
Tabletop, Jr. Broderbund Software. TERC.
Turtle Math. LCSI.
On-Line Resources
-
http://dimacs.rutgers.edu/archive/nj_math_coalition/framework.html/
The Framework will be available at this site during
Spring 1997. In time, we hope to post additional resources
relating to this standard, such as grade-specific activities submitted
by New Jersey teachers, and to provide a forum to discuss the
Mathematics Standards.
Standard 14 - Discrete Mathematics - Grades 5-6
Overview
The five major themes of discrete mathematics, as discussed in the
K-12 Overview, are systematic listing, counting, and
reasoning; discrete mathematical modeling using graphs (networks) and
trees; iterative (that is, repetitive) patterns and processes;
organizing and processing information; and following and
devising lists of instructions, called
"algorithms," and using them to find the best
solution to real-world problems. Two important resources
on discrete mathematics for teachers at all levels are the 1991 NCTM
Yearbook Discrete Mathematics Across the Curriculum K-12 and
the 1997 DIMACS Volume Discrete Mathematics in the Schools: Making
an Impact.
Despite their formidable titles, these five themes can be addressed
with activities at the 5-6 grade level which involve both the
purposeful play and simple analysis suggested for elementary school
students and experimentation and abstraction appropriate at the middle
grades. Indeed, teachers will discover that many activities that they
already are using in their classrooms reflect these themes. These
five themes are discussed in the paragraphs below.
The following discussion of activities at the 5-6 grade levels
in discrete mathematics presupposes that corresponding
activities have taken place at the K-4 grade levels. Hence 5-6 grade
teachers should review the K-2 and 3-4 grade level discussions
of discrete mathematics and might use activities similar to those
described there before introducing the activities for this
grade level.
Activities involving systematic listing, counting, and
reasoning at K-4 grade levels can be extended to the 5-6 grade
level. For example, they might determine the number of possible
license plates with two letters followed by three numbers followed by
one letter, and decide whether this total number of license plates is
adequate for all New Jersey drivers. They need to become familiar
with the idea of permutations, that is, the different ways in
which a group of items can be arranged. Thus, for example, if three
children are standing by the blackboard, there are altogether six
different ways, call permutations, in which this can be done; for
example, if the three children are Amy (A), Bethany (B), and Coriander
(C), the six different permutations can be described as ABC, ACB, BAC,
BCA, CAB, and CBA. Similarly, the total number of different ways in
which three students out of a class of thirty can be arranged at the
blackboard is altogether 30x29x28, or 24,360 ways, an amazing
total!
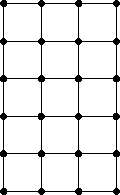 An important discrete mathematical model is that of a
network or graph, which consists of dots and lines
joining the dots; the dots are often called vertices (vertex is
the singular) and the lines are often called edges. (This is
different from other mathematical uses of the term "graph";
the two terms "network" and "graph" are used
interchangeably for this concept.) An example of a graph with 24
vertices and 38 edges is given at the left. Graphs can be used to
represent islands and bridges, or buildings and roads, or houses and
telephone cables; wherever a collection of things are joined by
connectors, the mathematical model used is that of a graph. At the
5-6 level, students should be familiar with thenotion of a graph and
recognize situations in which graphs can be an appropriate model. For
example, they should be familiar with problems involving routes for
garbage pick-ups, school buses, mail deliveries, snow removal, etc.;
they should be able to model such problems by using graphs, and be
able to solve such problems by finding suitable paths in these graphs,
such as in the town whose street map is the graph above.
Students should recognize and work with repetitive patterns and
processes involving numbers and shapes, with objects found in the
classroom and in the world around them. Building on these
explorations, fifth- and sixth-graders should also recognize and work
with iterative and recursive processes. They explore iteration
using Logo software, where they recreate a variety of interesting
patterns (such as a checkerboard) by iterating the construction of a
simple component of the pattern (in this case a square). As with
younger students, 5th and 6th graders are fascinated with the
Fibonacci sequence 1, 1, 2, 3, 5, 8, 13, 21, 34, 55, 89, ... where
every number is the sum of the previous two numbers. Although the
Fibonacci sequence starts with small numbers, the numbers in the
sequence become large very quickly. Students can now also begin to
understand the Fibonacci sequence and other sequences recursively
- where each term of the sequence is described in terms of
preceding terms.
Students in the 5th and 6th grade should investigate sorting
items using Venn diagrams, and continue their explorations
of recovering hidden information by decoding messages. They
should begin to explore how codes are used to communicate
information, by traditional methods such as Morse code or
semaphore (flags used for ship-to-ship messages) and also by current
methods such as zip codes, which describe a location in the United
States by a five-digit (or nine-digit) number. Students should also
explore modular arithmetic through applications involving clocks,
calendars, and binary codes.
Finally, at grades 5-6, students should be able to describe,
devise, and test algorithms for solving a variety of
problems. These include finding the shortest route from one
location to another, dividing a cake fairly, planning a tournament
schedule, and planning layouts for a class newspaper.
Two important resources on discrete mathematics for teachers at all
levels is the 1991 NCTM Yearbook Discrete Mathematics Across the
Curriculum K-12 and the 1997 DIMACS Volume Discrete Mathematics
in the Schools: Making An Impact. Another important
resource for 5-6 teachers is This Is MEGA-Mathematics!
Standard 14 - Discrete Mathematics - Grades 5-6
Indicators and Activities
The cumulative progress indicators for grade 8 appear below in
boldface type. Each indicator is followed by activities which
illustrate how it can be addressed in the classroom in grades 5 and
6.
Building upon knowledge and skills gained in the preceding grades,
experiences will be such that all students in grades 5-6:
6. Use systematic listing, counting, and
reasoning in a variety of different contexts.
- Students determine the number of different sandwiches or
hamburgers that can be created at local eateries using a combination
of specific ingredients.
- Students find the number of different ways to
make a row of flowers each of which is red or yellow, if the row has
1, 2, 3, 4, or 5 flowers. Modeling this with Unifix cubes, they
discover that adding an additional flower to the row doubles the
number of possible rows, provide explanations for this, and generalize
to longer rows. Similar activities can be found in the Pizza
Possibilities and Two-Toned Towers lessons that are
described in the First Four Standards of this
Framework.
- Students find the number of ways of asking three different
students in the class to write three homework problems on the
blackboard.
- Students understand and use the concept of permutation.
They determine the number of ways any five items can be arranged in
order, justify their conclusion using a tree diagram, and use
factorial notation, 5!, to summarize the result.
- Students find the number of possible telephone numbers with
a given area code and investigate why several years ago the telephone
company introduced a new area code (908) in New Jersey, and why
additional area codes are being introduced in 1997. Is the
situation the same with zip codes?
- Students estimate and then calculate the number
of possible license plates with two letters followed by three numbers
followed by one letter. They investigate why the state license bureau
tried to introduce license plates with seven characters and why this
attempt might have been unsuccessful.
- Students explore the sequence of triangular
numbers 1, 1 + 2, 1 + 2 + 3, 1 + 2 + 3 + 4, ... which represent the
number of dots in the triangular arrays below, and find the location
of the triangular numbers in Pascal's triangle.

- Students look for patterns in the various diagonals of
Pascal's triangle, and in the differences between consecutive
terms in these diagonals. Patterns in Pascal's
Triangle Poster is a nice resource for introducing these
ideas.
- Students analyze simple games like the following: Beth
wins the game whenever the two dice give an even total, and Hobart
wins whenever the two dice give an odd total. They play the game a
number of times, and using experimental evidence, decide whether the
game is fair, and, if not, which player is more likely to win. They
then try to justify their conclusions theoretically, by counting the
number of combinations of dice that would result in a win for each
player.
- Students create a table in the form of a grid which
indicates how many of each of the coins of the fictitious country
"Ternamy" - in denominations of 1, 3, 9, 27, and 81
"terns" - are needed to make up any amount from 1 to
200. They list the denominations in the columns at the top of the
table and the amounts they are trying to make in the rows at the left.
They write the number of each coin needed to add up to the desired
amount in the appropriate squares in that row. The only
"rule" to be followed is that the least number of coins must
be used; for example, three 1's should always be replaced by one 3.
This table can be used to introduce base 3 ("ternary")
numbers, and then numbers in other bases.
7. Recognize common discrete mathematical models, explore
their properties, and design them for specific
situations.
- Students experiment with drawing make-believe
maps which can be colored with two, three, and four colors (where
adjacent countries must have different colors), and explain why their
fictitious maps, and real maps like the map of the 50 states, cannot
be colored with fewer colors. Note that it was proven in 1976 that no
map can be drawn on a flat surface which requires more than four
colors. The Mathematician's Coloring Book contains
a variety of map-coloring activities, as well as historical background
on the map coloring problem.
- Students play games using graphs. For example,
in the strolling game, two players stroll together on a path through
the graph which never repeats itself; they alternate in selecting
edges for the path, and the winner is the one who selects the last
edge on the path. Who wins? In the game below, Charles
and Diane both start at V, Charles picks the first edge (marked 1) and
they both stroll down that edge. Then Diane picks the second edge
(marked 2) and the game continues. Diane has won this play of the
game since the path cannot be continued after the sixth edge without
repeating itself. Does Diane have a way of always winning
this game, or does Charles have a winning strategy? What if there was
a different starting point? What if a different graph was
used? What if the path must not cross itself (instead of
requiring that it not repeat itself)? Students should try to
explain in each case why a certain player has a winning
strategy.

- Students find paths in graphs which utilize each edge
exactly once; a path in a graph is asequence of edges each of which
begins where the previous one ends. They apply this idea by
converting a street map to a graph where vertices on the graph
correspond to intersections on the street map, and by using this graph
to determine whether a garbage truck can complete its sector without
repeating any streets. See the segment Snowbound: Euler
Circuits on the videotape Geometry: New Tools for New
Technologies; the module Drawing Pictures With One Line
provides a strong background for problems of this kind.
- Students plan emergency evacuation routes at school or from
home using graphs.
- All of the students together create a
"human graph" where each child in the class is holding two
strings, one in each hand. This can be accomplished by placing in the
center of the room a number of pieces of yarn (each six feet long)
equal to the number of students, and having each student take the ends
of two strings. The children are asked to untangle themselves, and
discuss or write about what happens.
- Students play the game of Sprouts, in which two
students take turns in building a graph until one of them (the
winner!) completes the graph. The rules are: start the game with two
or three vertices; each person adds an edge (it can be a curved line!)
joining two vertices, and then adds a new vertex at the center of that
edge; no more than three edges can occur at a vertex; edges may not
cross. In the sample game below, the second player (B) wins because
the first player (A) cannot draw an edge connecting the only two
vertices that have degree less than three without crossing an existing
edge.

8. Experiment with iterative and recursive processes,
with the aid of calculators and computers.
- Students develop a method for solving the Tower of Hanoi
problem: There are three pegs, on the first of which is stacked five
disks, each smaller than the ones underneath it (see diagram below);
the problem is to move the entire stack to the third peg, moving
disks, one at a time, from any peg to either of the other two pegs,
with no disk ever placed upon a smaller one. How many moves are
required to do this?

- Students use iteration in Logo software to draw
checkerboards, stars, and other designs. For example, they iterate the
construction of a simple component of a pattern, such as a square, to
recreate an entire checkerboard design.
- Students use paper rabbits (prepared by the teacher) with
which to simulate Fibonacci's 13th century investigation into the
growth of rabbit populations: If you start with one pairof
baby rabbits, how many pairs of rabbits will there be a year
later? Fibonacci's assumption was that each pair of baby
rabbits results in another pair of baby rabbits two months later
- allowing a month for maturation and a month for gestation.
Once mature, each pair has baby rabbits monthly. (Each pair of
students should be provided with 18 cardboard pairs each of baby
rabbits, not-yet-mature rabbits, and mature rabbits.) The
Fascinating Fibonaccis by Trudi Garland illustrates the
rabbit problem and a number of other interesting Fibonacci facts. In
Mathematics Mystery Tour by Mark Wahl, an elementary school
teacher provides a year's worth of Fibonacci explorations and
activities.
- Students use calculators to compare the growth
of various sequences, including counting by 4's (4, 8, 12, 16, ... ),
doubling (1, 2, 4, 8, 16, ... ), squaring (1, 4, 9, 16, 25, ... ), and
Fibonacci (1, 1, 2, 3, 5, 8, 13, ... ).
- Students explore their surroundings to find rectangular
objects whose ratio of length to width is the "golden
ratio." Since the golden ratio can be approximated by the ratio
of two successive Fibonacci numbers, students should cut a rectangular
peephole of dimensions 21mm x 34 mm out of a piece of cardboard, and
use it to "frame" potential objects; when it
"fits," the object is a golden rectangle. They describe
these activities in their math journals.
- Students study the patterns of patchwork quilts, and make
one of their own. They might first read Eight Hands Round.
- Students make equilateral triangles whose sides are
9", 3", and 1" (or other lengths in ratio 3:1), and use
them to construct "Koch snowflakes of stage 2" (as shown
below) by pasting the 9" triangle on a large sheet of paper,
three 3" triangles at the middle of the three sides of the
9" triangle (pointing outward), and twelve 1" triangles at
the middle of the exposed sides of the twelve 3" segments
(pointing outward). To get Koch snowflakes of stage 3, add
forty-eight 1/3" equilateral triangles. How many 1/9"
equilateral triangles would be needed for the Koch snowflake of
stage 4? Fractals for the Classroom is a valuable resource
for these kinds of activities and explorations.

- Students mark one end of a long string and make another
mark midway between the two ends. They then continue marking the
string by following some simple rule such as "make a new mark
midway between the last midway mark and the marked end" and then
repeat this instruction. Students investigate the relationship of the
lengths of the segments between marks. How many marks are possible
in this process if it is assumed that the marks take up no
space on the string? What happens if the rule is changed to
"make a new mark midway between the last two
marks?"
9. Explore methods for storing, processing, and
communicating information.
- After discussing possible methods for communicating
messages across a football field, teams of students devise methods for
transmitting a short message (using flags, flashlights, arm signals,
etc.). Each team receives a message of the same length and must
transmit it to members of the team at the other end of the field as
quickly and accurately as possible.
- Students devise rules so that arithmetic expressions
without parentheses, such as 5 x 8 - 2 / 7, can be
evaluated unambiguously. They then experiment with calculators to
discover the calculators' built-in rules for evaluating these
expressions.
- Students explore binary arithmetic and arithmetic for other
bases through applications involving clocks (base 12), days of the
week (base 7), and binary (base 2) codes.
- Students assign each letter in the alphabet a numerical
value (possibly negative) and then look for words worth a specified
number of points.
- Students send and decode messages in which letters of the
message are systematically replaced by other letters. The Secret
Code Book by Helen Huckle shows these coding systems as well as
others.
-
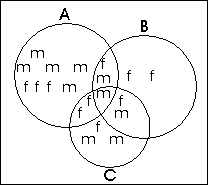 Students use Venn diagrams to sort and then report on
their findings in a survey. For example, they can seek responses to
the question, When I grow up I want to be a) rich and
famous, b) a parent, c) in a profession I love, where
respondents can choose more than one option. The results can be
sorted into a Venn diagram like that at the right, where entries
"m" and "f" are used for male and female
students. The class can then determine answers to questions like
Are males or females in our class more likely to have a single
focus? Tabletop, Jr. software can be used to sort and
explore data using Venn diagrams.
10. Devise, describe, and test algorithms for
solving optimization and search problems.
- Students use a systematic procedure to find the total
number of routes from one location in their town to another, and the
shortest such route. (See Problem Solving Using Graphs.)
- In Turtle Math, students use Logo
commands to go on a treasure hunt, and look for the shortest route to
complete the search.
- Students discuss and write about various methods of
dividing a cake fairly, such as the "divider/chooser method"
for two people (one person divides, the other chooses) and the
"lone chooser method" for three people (two people divide
the cake using the divider/chooser method, then each cuts his/her half
into thirds, and then the third person takes one piece from each of
the others). Fair Division: Getting Your Fair Share can be
used to explore methods of fairly dividing a cake or an estate.
- Students conduct a class survey for the top ten songs and
discuss different ways to use the information to select the
winners.
- Students devise a telephone tree for disseminating messages
to all 6th grade students and their parents.
- Students schedule the matches of a volleyball tournament in
which each team plays each other team once.
- Students use flowcharts to represent visually the
instructions for carrying out a complex project, such as scheduling
the production of the class newspaper.
- Students develop an algorithm to create an efficient layout
for a class newspaper.
References
-
Bennett, S., et al. Fair Division: Getting Your Fair
Share. Consortium for Mathematics and Its Applications
(COMAP). Module #9, 1987.
Casey, Nancy, and Mike Fellows. This is MEGA-Mathematics!
- Stories and Activities for
Mathematical Thinking, Problem-Solving, and Communication.
Los Alamos, CA: Los Alamos National Laboratories, 1993. (A
version is available online at
http://www.c3.lanl.gov/mega-math)
Chavey, D. Drawing Pictures With One Line. Consortium
for Mathematics and Its Applications (COMAP). Module #21,
1992.
Cozzens, M., and R. Porter. Problem Solving Using Graphs.
Consortium for Mathematics and Its Applications (COMAP). Module
#6, 1987.
Francis, R. The Mathematician's Coloring
Book. Consortium for Mathematics and Its Applications
(COMAP). Module #13.
Garland, Trudi. The Fascinating Fibonaccis. Palo Alto,
CA: Dale Seymor Publications, 1987.
Huckle, Helen. The Secret Code Book. Dial Books.
Kenney, M. J., Ed. Discrete Mathematics Across the Curriculum
K-12. 1991 Yearbook of the National Council of Teachers of
Mathematics (NCTM). Reston, VA, 1991.
Paul, A. Eight Hands Round. New York: Harper Collins,
1991.
Peitgen, Heinz-Otto, et al. Fractals for the Classroom:
Strategic Activities Volume One & Two. Reston, VA: NCTM and
New York: Springer- Verlag, 1992.
Rosenstein, J. G., D. Franzblau, and F. Roberts, Eds.
Discrete Mathematics in the Schools:
Making an Impact. Proceedings of a 1992 DIMACS Conference
on "Discrete Mathematics in the Schools." DIMACS Series
on Discrete Mathematics and Theoretical Computer Science.
Providence, RI: American Mathematical Society (AMS), 1997.
(Available online from this chapter in
http://dimacs.rutgers.edu/archive/nj_math_coalition/framework.html/.)
Wahl, Mark. Mathematical Mystery Tour: Higher-Thinking Math
Tasks. Tucson, AZ: Zephyr Press, 1988.
Software
-
Logo. Many versions of Logo are commercially
available.
Tabletop, Jr. Broderbund, TERC.
Turtle Math. LCSI.
Video
-
Geometry: New Tools for New Technologies, videotape by
the Consortium for Mathematics and Its Applications (COMAP).
Lexington, MA, 1992.
On-Line Resources
-
http://dimacs.rutgers.edu/archive/nj_math_coalition/framework.html/
The Framework will be available at this site during
Spring 1997. In time, we hope to post additional resources
relating to this standard, such as grade-specific activities submitted
by New Jersey teachers, and to provide a forum to discuss the
Mathematics Standards.
Standard 14 - Discrete Mathematics - Grades 7-8
Overview
The five major themes of discrete mathematics, as discussed in the
K-12 Overview, are systematic listing, counting, and
reasoning; discrete mathematical modeling using graphs (networks) and
trees; iterative (that is, repetitive) patterns and processes;
organizing and processing information; and following and
devising lists of instructions, called
"algorithms," and using them to find the best
solution to real-world problems.
Despite their formidable titles, these five themes can be addressed
with activities at the 7-8 grade level which involve both the
purposeful play and simple analysis suggested for elementary school
students and experimentation and abstraction appropriate at the middle
grades. Indeed, teachers will discover that many activities that they
already are using in their classrooms reflect these themes. These
five themes are discussed in the paragraphs below.
The following discussion of activities at the 7-8 grade levels
in discrete mathematics presupposes that corresponding
activities have taken place at the K-6 grade levels. Hence 7-8 grade
teachers should review the K-2, 3-4, and 5-6 grade level
discussions of discrete mathematics and might use activities similar
to those described there before introducing the activities for
this grade level.
Students in 7th and 8th grade should be able to use permutations
and combinations and other counting strategies in a wide
variety of contexts. In addition to working with permutations,
where the order of the items is important (see Grades 5-6 Overview and
Activities), they should also be able to work with combinations, where
the order of the items is irrelevant. For example, the number of
different three digit numbers that can be made using three different
digits is 10x9x8 because each different ordering of the three digits
results in a different number. However, the number of different
pizzas that can be made using three of ten available toppings is
(10x9x8)/(3x2x1) because the order in which the toppings are
added is irrelevant; the division by 3x2x1 eliminates the
duplication.
An important discrete mathematical model is that of a
network or graph, which consists of dots and lines
joining the dots; the dots are often called vertices (vertex is
the singular) and the lines are often called edges. (This is
different from other mathematical uses of the term "graph.")
Graphs can be used to represent islands and bridges, or buildings and
roads, or houses and telephone cables; wherever a collection of things
are joined by connectors, the mathematical model used is that of a
graph. Students in the 7th and 8th grades should be able to use
graphs to model situations and solve problems using the
model. For example, students should be able to use graphs
to schedule a school's extracurricular activities so that, if at
all possible, no one is excluded because of conflicts. This can be
done by creating a graph whose vertices are the activities, with two
activities joined by an edge if they have a person in common, so that
the activities should be scheduled for different times. Coloring the
vertices of the graph so that adjacent vertices have different colors,
using a minimum number of colors, then provides an efficient solution
to the scheduling problem - a separate time slot is needed for
each color, and two activities are scheduled for the same time slot if
they have the same color.
Students can recognize and work with iterative and recursive
processes, extending their earlierexplorations of repetitive
patterns and procedures. In the 7th and 8th grade, they can
combine their understanding of exponents and iteration to solve
problems involving compound interest with a calculator or spreadsheet.
Topics which before were viewed iteratively - arriving at the
present situation by repeating a procedure n times - can
now be viewed recursively - arriving at the present situation by
modifying the previous situation. They can apply this understanding
to Fibonacci numbers, to the Tower of Hanoi puzzle, to programs in
Logo, to permutations and to other areas.
Students in the 7th and 8th grades should explore how codes are
used to communicate information, by traditional methods such as
Morse code or semaphore (flags used for ship-to-ship messages) and
also by current methods such as zip codes. Students should
investigate and report about various codes that are commonly used,
such as binary codes, UPCs (universal product codes) on grocery items,
and ISBN numbers on books. They should also explore how
information is processed. A useful metaphor is how a waiting line
or queue is handled (or "processed") in various situations;
at a bank, for example, the queue is usually processed in
first-in-first-out (FIFO) order, but in a supermarket or restaurant
there is usually a pre-sorting into smaller queues done by the
shoppers themselves before the FIFO process is activated.
In the 7th and 8th grade, students should be able to use
algorithms to find the best solution in a number of
situations - including the shortest route from one city to
another on a map, the cheapest way of connecting sites into a network,
the fastest ways of alphabetizing a list of words, the optimal route
for a class trip (see the Short-Circuiting Trenton lesson in
the Introduction to this Framework), or optimal work schedules
for employees at a fast-food restaurant.
Two important resources on discrete mathematics for teachers at all
levels are the 1991 NCTM Yearbook Discrete Mathematics Across the
Curriculum K-12 and the 1997 DIMACS Volume Discrete Mathematics
in the Schools: Making an Impact. Teachers of grades 7-8
would also find useful the textbook Discrete Mathematics
Through Applications.
Standard 14 - Discrete Mathematics - Grades 7-8
Indicators and Activities
The cumulative progresses indicators for grade 8 appear below in
boldface type. Each indicator is followed by activities which
illustrate how it can be addressed in the classroom in grades 7 and
8.
Building upon knowledge and skills gained in the preceding grades,
experiences will be such that all students in grades 7-8:
6. Use systematic listing, counting, and reasoning in a
variety of different contexts.
- Students determine the number of possible different
sandwiches or hamburgers that can be created at local eateries using a
combination of specified ingredients. They find the number of pizzas
that can be made with three out of eight available toppings and relate
the result to the numbers in Pascal's triangle.
- Students determine the number of dominoes in a set
that goes up to 6:6 or 9:9, the number of candles used throughout
Hannukah, and the number of gifts given in the song "The Twelve
Days of Christmas," and connect the results through discussion
of the triangular numbers. (Note that in a 6:6 set of dominoes there
is exactly one domino with each combination of dots from 0 to 6.)
- Students determine the number of ways of spelling
"Pascal" in the array below by following a path from top to
bottom in which each letter is directly below, and just to the right
or left of the previous letter.
|
|
|
|
|
P |
|
|
|
|
|
|
|
|
|
A |
|
A |
|
|
|
|
|
|
|
S |
|
S |
|
S |
|
|
|
|
|
C |
|
C |
|
C |
|
C |
|
|
|
A |
|
A |
|
A |
|
A |
|
A |
|
| L |
|
L |
|
L |
|
L |
|
L |
|
L |
- Students design different license plate systems for
different population sizes; for example, how large would the
population be before you would run out of plates which had only three
numbers, or only five numbers, or two letters followed by three
numbers?
- Students find the number of different ways of making
a row of six red and yellow flowers, organize and tabulate the
possibilities according to the number of flowers of the first color,
and explain the connection with the numbers in the sixth row of
Pascal's triangle. (See also Visual Patterns in
Pascal's Triangle.)
- Students pose and act out problems involving the
number of different ways a group of people can sit around a table,
using as motivation the scene of the Mad Hatter at the tea party.
(See Mathematics, a Human Endeavor, p. 394.)
- Students count the total number of different cubes
that can be made using either red or green paper for each face. (To
solve this problem, they will have to use a "break up the problem
into cases" strategy.)
- Students determine the number of handshakes that
take place if each person in a room shakes hands with every other
person exactly once, and relate this total to the number of line
segments joining the vertices in a polygon, to the number of
two-flavor ice-cream cones, and to triangular numbers.
- Students count the number of triangles or
rectangles in a geometric design. For example, they should be able to
count systematically the number of triangles (and trapezoids) in the
figure below to the left, noting that there are triangles of three
sizes, and the number of rectangles in the 4x5 grid pictured below to
the right, listing first all dimensions of rectangles that are
present.
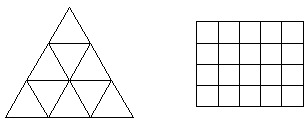
7. Recognize common discrete mathematical models,
explore their properties, and design them for specific
situations.
- Students find the minimum number of colors needed to assign
colors to all vertices in a graph so that any two adjacent vertices
are assigned different colors and justify their answers. For example,
students can explain why one of the graphs below requires four colors
while for the other, three colors are sufficient.

-
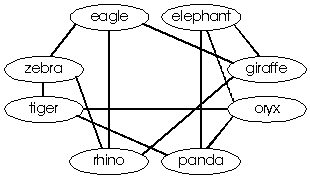 Students use graph coloring to solve problems which
involve avoiding conflicts such as: scheduling the school's
extra curricular activities; scheduling referees for soccer games;
determining the minimum number of aquariums needed for a specified
collection of tropical fish; and assigning channels to radio stations
to avoid interference. In the graph at the right an edge between two
animals indicates that they cannot share a habitat. The videotape,
Geometry: New Tools for New Technologies has a segment
Connecting the Dots: Vertex Coloring which discusses
the minimum number of habitats required for this situation.
- Students use tree diagrams to represent and analyze
possible outcomes in counting problems, such as tossing two dice.
- Students determine whether or not a given group of dominoes
can be arranged in a line (or in a rectangle) so that the number of
dots on the ends of adjacent dominoes match. For example, the
dominoes (03), (05), (12), (14), (15), (23), (34) can be arranged as
(12), (23), (30), (05), (51), (14), (43); and if an eighth domino (13)
is added, they can be formed into a rectangle. What if instead the
eighth domino was (24) - could they then be
arranged in a rectangle or in a line?
- Students determine the minimum number of blocks that a
police car has to repeat if it must try to patrol each street exactly
once on a given map. Drawing Pictures With One Line contains
similar real-world problems and a number of related game
activities.
- Students find the best route for collecting recyclable
paper from all classrooms in the school, and discuss different ways of
deciding what is the "best." (See Drawing Pictures
With One Line.)
- Students make models of various polyhedra with
straws and string, and explore the relationship between the number of
edges, faces, and vertices.
8. Experiment with iterative and recursive processes,
with the aid of calculators and computers.
9. Explore methods for storing, processing, and
communicating information.
- Students conjecture which of the following (and other)
methods is the most efficient way of handing back corrected homework
papers which are already sorted alphabetically: (1) the teacher walks
around the room handing to each student individually; (2) students
pass the papers around, each taking their own; (3) students line
themselves up in alphabetical order. Students test their conjectures
and discuss the results.
- Students investigate and report about various codes
that are commonly used, such as zip codes, UPCs (universal product
codes) on grocery items, and ISBN numbers on books. (A good source for
information about these and other codes is Codes Galore by
J. Malkevitch, G. Froelich, and D. Froelich.)
- Students write a Logo procedure for making a rectangle that
uses variables, so that they can use their rectangle procedure to
create a graphic scene which contains objects, such as buildings, of
varying sizes.
- Students are challenged to guess a secret word chosen by
the teacher from the dictionary, using at most 20 yes-no questions.
Is this always, or only sometimes possible?
- Students use Venn diagrams to solve problems
like the following one from the New Jersey Department of
Education's Mathematics Instruction Guide (p. 7-13).
Suppose the school decided to add the springtime sport of
lacrosse to its soccer and basketball offerings for its 120
students. A follow-up survey showed that: 35 played lacrosse, 70
played soccer, 40 played basketball, 20 played both soccer and
basketball, 15 played both soccer and lacrosse, 15 played both
basketball and lacrosse, and 10 played all three sports. Using
this data, complete a Venn diagram and answer the following
questions: How many students played none of the three sports?
What percent of the students played lacrosse as their only
sport? How many students played both basketball and lacrosse, but not
soccer?
- Students keep a scrapbook of different ways in which
information is stored or processed. For example a list of events is
usually stored by date, so the scrapbook might contain a picture of a
pocket calendar; a queue of people at a bank is usually processed in
first-in-first-out (FIFO) order, so the scrapbook could contain a
picture of such a queue. (How is this different from the
waiting lines in a supermarket, or at a restaurant?)
- Students determine whether it is possible to have a year in
which there is no Friday the 13th, and the maximum number of Friday
the 13th's that can occur in one calendar year.
- Students predict and then explore the frequency of letters
in the alphabet through examination of sample texts, computer
searches, and published materials.
- Students decode messages where letters are systematically
replaced by other letters without knowing the system by which letters
are replaced; newspapers and games magazines are good sources for
"cryptograms" and students can create their own. They also
explore the history of code-making and code-breaking. The videotape
Discrete Mathematics: Cracking the Code provides a good
introduction to the uses of cryptography and the mathematics behind
it.
10.Devise, describe, and test algorithms for solving
optimization and search problems.
- Students find the shortest route from one city to another
on a New Jersey map, and discuss whether that is the best route. (See
Problem Solving Using Graphs.)
- Students write and solve problems involving distances,
times, and costs associated with going from towns on a map to other
towns, so that different routes are "best" according to
different criteria.
- Students use binary representations of numbers to find
winning strategy for Nim. (See Mathematical Investigations for
other mathematical games.)
- Students plan an optimal route for a
class trip. (See the Short-circuiting Trenton lesson in the
Introduction to this Framework.)
- Students devise work schedules for employees of a
fast-food restaurant which meet specified conditions yet minimize the
cost.
- Students compare strategies for alphabetizing a list
of words, and test to see which strategies are more efficient.
-
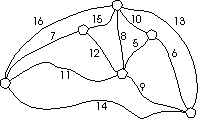 Students find a network of roads which
connects a number of sites and involves the smallest cost. In
the example at the right, what roads should be built so
as to minimize the total cost, where the number on each road
reflects the cost of building that road (in hundreds of
thousands of dollars)?
- Students develop a precise description of the
standard algorithm for adding two two-digit integers.
- Students devise strategies for dividing up the
work of adding a long list of numbers among the members of the
team.
References
-
Chavey, D. Drawing Pictures with One Line. Consortium
for Mathematics and Its Applications (COMAP), Module #21, 1987.
Cozzens, M., and R. Porter. Problem Solving Using Graphs.
Consortium for Mathematics and Its Applications (COMAP), Module #6,
1987.
Crisler, N., P. Fisher, and G. Froelich, Discrete Mathematics
Through Applications. W. H. Freeman and Company, 1994.
Jacobs, H. R. Mathematics: A Human Endeavor.
W. H. Freeman and Company, 1982.
Kenney, M. J., Ed. Discrete Mathematics Across the Curriculum
K-12, 1991 Yearbook of the National Council of Teachers of
Mathematics (NCTM). Reston, VA: 1991.
Malkevitch, J., G. Froelich, and D. Froelich, Codes
Galore, Consortium for Mathematics and Its Applications
(COMAP), Module #18, 1991.
New Jersey Department of Education. Mathematics Instruction
Guide. D. Varygiannis, Coord. January 1996.
Peitgen, Heinz-Otto, et al. Fractals for the Classroom:
Strategic Activities Volume One & Two. Reston, VA: NCTM and
New York: Springer- Verlag, 1992.
Rosenstein, J. G., D. Franzblau, and F. Roberts, Eds.
Discrete Mathematics in the Schools:
Making an Impact. Proceedings of a 1992 DIMACS Conference
on "Discrete Mathematics in the Schools." DIMACS Series
on Discrete Mathematics and Theoretical Computer Science.
Providence, RI: American Mathematical Society (AMS), 1997.
(Available online from this chapter in
http://dimacs.rutgers.edu/archive/nj_math_coalition/framework.html/.)
Seymour, D. Visual Patterns in Pascal's
Triangle. Palo Alto, CA: Dale Seymour Publications, 1986.
Souviney, R., et al. Mathematical Investigations. Book
One, Dale Seymour Publications, 1990.
Video
-
Discrete Mathematics: Cracking the Code,
Consortium for Mathematics and Its Applications.
Geometry: New Tools for New Technologies,
videotape by the Consortium for Mathematics and Its Applications
(COMAP). Lexington, MA, 1992.
On-Line Resources
-
http://dimacs.rutgers.edu/archive/nj_math_coalition/framework.html/
The Framework will be available at this site during
Spring 1997. In time, we hope to post additional resources
relating to this standard, such as grade-specific activities submitted
by New Jersey teachers, and to provide a forum to discuss the
Mathematics Standards.
Standard 14 - Discrete Mathematics - Grades 9-12
Overview
The five major themes of discrete mathematics, as discussed in the
K-12 Overview, are systematic listing, counting, and
reasoning; discrete mathematical modeling using graphs (networks) and
trees; iterative (that is, repetitive) patterns and processes;
organizing and processing information; and following and
devising lists of instructions, called
"algorithms," and using them to find the best
solution to real-world problems.
The following discussion of activities at the 9-12 grade levels
in discrete mathematics presupposes that corresponding
activities have taken place at the K-8 grade levels. Hence high
school teachers should review the discussions of discrete
mathematics at earlier grade levels and might use activities similar
to those described there before introducing the activities for
these grade levels.
At the high school level, students are becoming familiar with
algebraic and functional notation, and their understanding of all of
the themes of discrete mathematics and their ability to generalize
earlier activities should be enhanced by their algebraic skills and
understandings. Thus, for example, they should use formulas to
express the results of problems involving permutations and
combinations, relate Pascal's triangle to the coefficients of the
binomial expansion of (x+y)n, explore models
of growth using various algebraic models, explore iterations of
functions, and discuss methods for dividing an estate among several
heirs.
At the high school level, students are particularly interested in
applications; they ask What is all of this good for?
In all five areas of discrete mathematics, students should focus on
how discrete mathematics is used to solve practical
problems. Thus, for example, they should be able to apply their
understanding of counting techniques, to analyze lotteries; of graph
coloring, to schedule traffic lights at a local intersection; of paths
in graphs, to devise patrol routes for police cars; of iterative
processes, to analyze and predict fish populations in a pond or
concentration of medicine in the bloodstream; of codes, to understand
how bar-code scanners detect errors and how CD's correct errors;
and of optimization, to understand the 200 year old debates about
apportionment and to find efficient ways of scheduling the components
of a complex project.
Two important resources on discrete mathematics for teachers at all
grade levels are the 1991 NCTM Yearbook, Discrete Mathematics
Across the Curriculum K-12 and the DIMACS Volume, Discrete
Mathematics in the Schools: Making an Impact edited
by J. Rosenstein, D. Franzblau, and F. Roberts. Useful resources at
the high school level are Discrete Mathematics Through
Applications by N. Crisler, P. Fisher, and G. Froelich; For All
Practical Purposes: Introduction to Contemporary
Mathematics, by the Consortium for Mathematics and its
Applications; and Excursions in Modern Mathematics by
P. Tannenbaum and R. Arnold.
Standard 14 - Discrete Mathematics - Grades 9-12
Indicators and Activities
The cumulative progress indicators for grade 12 appear below in
boldface type. Each indicator is followed by activities which
illustrate how it can be addressed in the classroom in grades 9, 10,
11, and 12.
Building upon knowledge and skills gained in the preceding grades,
experiences will be such that all students in grades 9-12:
11. Understand the basic principles of iteration,
recursion, and mathematical induction.
- Students relate the possible outcomes of tossing five coins
with the binomial expansion of (x+y)5 and the fifth row of
Pascal's triangle, and generalize to values of n other
than 5.
- Students develop formulas for counting paths on grids or
other simple street maps.
- Students find the number of cuts needed in order to divide
a giant pizza so that each student in the school gets at least one
piece.
- Students develop a precise description, using
iteration, of the standard algorithm for adding two
integers.
12. Use basic principles to solve combinatorial and
algorithmic problems.
- Students determine the
number of ways of spelling "mathematics" in the array below
by following a path from top to bottom in which each letter is
directly below, and just to the right or left of the previous
letter.
|
|
|
|
|
M |
|
|
|
|
|
|
|
|
|
A |
|
A |
|
|
|
|
|
|
|
T |
|
T |
|
T |
|
|
|
|
|
H |
|
H |
|
H |
|
H |
|
|
|
E |
|
E |
|
E |
|
E |
|
E |
|
| M |
|
M |
|
M |
|
M |
|
M |
|
M |
|
A |
|
A |
|
A |
|
A |
|
A |
|
|
|
T |
|
T |
|
T |
|
T |
|
|
|
|
|
I |
|
I |
|
I |
|
|
|
|
|
|
|
C |
|
C |
|
|
|
|
|
|
|
|
|
S |
|
|
|
|
|
- Students determine the number of ways a committee of three
members could be selected from the class, and the number of ways three
people with specified roles could be selected. They generalize this
activity to finding a formula for the number of ways an n
person committee can be selected from a class of m people, and
the number of ways n people with specified roles can be
selected from a class of m people.
- Students find the number of ways of lining up thirty
students in a class, and compare that to other large numbers; for
example, they might compare it to the number of raindrops (volume = .1
cc) it would take to fill a sphere the size of the earth (radius =
6507 KM).
- Students determine the number of ways of dividing 52 cards
among four players, as in the game of bridge, and compare the number
of ways of obtaining a flush (five cards of the same suit) and a full
house (three cards of one denomination and two cards of another) in
the game of poker.
- Students play Nim (and similar games) and discuss winning
strategies using binary representations of numbers.
13. Use discrete models to represent and solve
problems.
- Students study the four color theorem and its
history. (The Mathematicians' Coloring Book
provides a good background for coloring problems.)
- Students using graph coloring to determine the minimum
number of guards (or cameras) needed for museums of various shapes
(and similarly for placement of lawn sprinklers or motionsensor
burglar alarms).
- Students use directed graphs to represent tournaments
(where an arrow drawn from A to B represents "A defeats B")
and food webs (where an arrow drawn from A to B represents "A
eats B"), and to construct oneway orientations of streets in a
given town which involve the least inconvenience to drivers. (A
directed graph is simply a graph where each edge is thought of as an
arrow pointing from one endpoint to the other.)
- Students use tree diagrams to analyze the play of games
such as tic-tac-toe or Nim, and to represent the solutions to weighing
problems. Example: Given 12 coins one of which is "bad,"
find the bad one, and determine whether it is heavier or lighter than
the others, using three weighings.
- Students use graph coloring to schedule the school's
final examinations so that no student has a conflict, if at all
possible, or to schedule traffic lights at an intersection.
- Students devise graphs for which there is a path that
covers each edge of the graph exactly once, and other graphs which
have no such paths, based on an understanding of necessary and
sufficient conditions for the existence of such paths, called
"Euler paths," in a graph. Drawing Pictures With One
Line provides background and applications for Euler path
problems.
- Students make models of polyhedra with straws and string,
and explore the relationship between the numbers of edges, faces, and
vertices, and generalize the conclusion to planar graphs.
- Students use graphs to solve problems like the
"fire-station problem": Given a city where the
streets are laid out in a grid composed of many square blocks, how
many fire stations are needed to provide adequate coverage of
the city if each fire station services its square block and the
four square blocks adjacent to that one? The Maryland Science
Center in Baltimore has a hands-on exhibit involving a fire-station
problem for 35 square blocks arranged in a six-by-six grid with one
corner designated a park.
14. Analyze iterative processes with the aid of
calculators and computers.
- Students analyze the Fibonacci sequence 1, 1, 2, 3, 5, 8,
13, 21, ... as a recurrence relation A
n + 2 = An +
An + 1 with connections to the golden
ratio. Fascinating Fibonaccis illustrates a variety of
connections between Fibonacci numbers and the golden ratio.
- Students solve problems involving compound
interest using iteration on a calculator or on a
spreadsheet.
- Students explore examples of linear growth, using
the recursive model based on the formula An+1 =
An + d, where d is the common difference, and convert it
to the explicit linear formula, An+1 = A1 + n
× d.
- Students explore examples of population growth,
using the recursive model based on the formula An+1 =
An x r, where r is the common multiple or growth rate,
convert it to the explicit exponential formula An+1 =
A1 rn, and apply it to both economics (such as
interest problems) and biology (such as concentration of medicine in
blood supply).
- Students explore logistic growth models of
population growth, using the recursive model based on the formula
An+1 = An x (1 - An) x r, where
r is the growth rate and An is the fraction of the
carrying capacity of the environment, and apply this to the population
of fish in a pond. Using a spreadsheet, students experiment with
various values of the initial value A1 and of the growth
rate, and describe the relationship between the values chosen and the
long term behavior of the population.
- Students explore the pattern resulting from
repeatedly multiplying
 by itself.
- Students use a calculator or a computer to study
simple Markov chains, such as weather prediction and population growth
models. (See Chapter 7.3 of Discrete Mathematics Through
Applications.)
- Students explore graphical iteration by choosing
a function key on a calculator and pressing it repeatedly, after
choosing an initial number, to get sequences of numbers like 2, 4, 8,
16, 32, ... or 2, sqrt(2), sqrt(sqrt(2)),
sqrt(sqrt(sqrt(2))),
.... . They use the graphs of the functions to explain the behavior of
the sequences obtained. They extend these explorations by iterating
functions they program into the calculator, such as linear functions,
where slope is the predictor of behavior, and quadratic functions f
(x) = ax (1 - x), where 0< x <1 and 1< a <4, which
exhibit chaotic behavior.
- Students explore iteration behavior using the function
defined by the two cases
-
| f(x) = x + 1/2 |
for x between 0 and 1/2 |
| f(x) = 2 - 2x |
for x between 1/2 and 1 |
They use the initial values 1/2, 2/3, 5/9, and 7/10, and then, with
a calculator or computer, the initial values .501, .667, and .701
(which differ by a small amount from the first group of
"nice" initial values). They compare the behavior of the
sequences generated by these values to the sequences generated by the
previous initial values.
- Students play the Chaos Game. Each pair
of students is provided with an identical transparency on which have
been drawn the three vertices L, T, and R of an equilateraltriangle.
Each team starts by selecting any point on the triangle. They roll a
die and create a new point halfway to L if they roll 1 or 2, halfway
to R if they roll 3 or 4, and halfway to T if they roll 5 or 6. They
repeat 20 times, each time using the new point as the starting point
for the next iteration. The teacher overlays all of the
transparencies and out of this chaos comes ... the familiar Sierpinski
triangle. (The Sierpinski triangle is discussed in detail in the
sections for earlier grade levels. Also see Unit 2 in Fractals for
the Classroom. The Chaos Game software allows
students to try variations and explore the game
further.)
15. Apply discrete methods to storing, processing, and
communicating information.
- Students discuss various algorithms used for sorting large
numbers of items alphabetically or numerically, and explain why some
sorting algorithms are substantially faster than others. To introduce
the topic of sorting, give each group of students 100 index cards each
with one word on it, and let them devise strategies for efficiently
putting the cards into alphabetical order.
- Students discuss how scanners of bar codes (zip
codes, UPCs, and ISBNs) are able to detect errors in reading the
codes, and evaluate and compare how error-detection is accomplished in
different codes. (See the COMAP Module Codes Galore or Chapter
9 of For All Practical Purposes.)
- Students investigate methods of error correction
used to transmit digitized pictures from space (Voyager or Mariner
probes, or the Hubble space telescope) over noisy or unreliable
channels, or to ensure the fidelity of a scratched CD recording. (See
Chapter 10 of For All Practical Purposes.)
- Students read about coding and code-breaking machines and
their role in World War II.
- Students research topics that are currently discussed in
the press, such as public-key encryption, enabling messages to be
transmitted securely, and data-compression, used to save space on a
computer disk.
16. Apply discrete methods to problems of voting,
apportionment, and allocations, and use fundamental strategies
of optimization to solve problems.
- Students find the best route when a number of alternate
routes are possible. For example: In which order should you pick
up the six friends you are driving to the school dance? In
which order should you make the eight deliveries for the drug
store where you work? In which order should you visit the
seven "must-see" sites on your vacation
trip? In each case, you want to find the "best route,"
the one which involves the least total distance, or least total time,
or least total expense. Students create their own problems, using
actual locations and distances, and find the best route. For a larger
project, students can try to improve the route taken by their school
bus.
- Students study the role of apportionment in American
history, focusing on the 1790 census (acting out the positions of the
thirteen original states and discussing George Washington's first
use of the presidential veto), and the disputed election of 1876, and
discuss the relative merits of different systems of apportionment that
have been proposed and used. (This activity provides an opportunity
for mathematics and history teachers to work together.) They also
devise a student government where the seats are fairly
apportionedamong all constituencies. (See the COMAP module The
Apportionment Problem or Chapter 14 of For All Practical
Purposes.)
- Students analyze mathematical methods for dividing an
estate fairly among various heirs. (See Chapter 2 of Discrete
Mathematics Through Applications, Chapter 3 of Excursions in
Modern Mathematics, or Chapter 13 of For All Practical
Purposes.)
- Students discuss various methods, such as preference
schedules or approval voting, that can be used for determining the
winner of an election involving three or more candidates (for example,
the prom king or queen). With preference schedules, each voter ranks
the candidates and the individual rankings are combined, using various
techniques, to obtain a group ranking; preference schedules are used,
for example, in ranking sports teams or determining entertainment
awards. In approval voting, each voter can vote once for each
candidate which she finds acceptable; the candidate who receives the
most votes then wins the election. (See the COMAP module The
Mathematical Theory of Elections or Chapter 11 of For All
Practical Purposes.)
- Students find an efficient way of doing a complex project
(like preparing an airplane for its next trip) given which tasks
precede which and how much time each task will take. (See Chapter 8 of
Excursions of Modern Mathematics or Chapter 3 of For All
Practical Purposes.)
- Students find an efficient way of assigning songs of
various lengths to the two sides of an audio tape so that the total
times on the two sides are as close together as possible. Similarly,
they determine the minimal number of sheets of plywood needed to build
a cabinet with pieces of specified dimensions.
- Students apply algorithms for matching in graphs to
schedule when contestants play each other in the different rounds of a
tournament.
- Students devise a strategy for finding a "secret
number" from 1 to 1000 using questions of the form Is your
number bigger than 837? and determine the least number of
questions needed to find the secret number.
References
-
Bennett, S., D. DeTemple, M. Dirks, B. Newell, J. Robertson, and
B. Tyus. The Apportionment Problem:
The Search for the Perfect Democracy. Consortium for Mathematics
and Its Applications (COMAP), Module #18, 1986.
Chavey, D. Drawing Pictures with One Line. Consortium
for Mathematics and Its Applications (COMAP), Module #21, 1987.
Consortium for Mathematics and Its Applications. For All
Practical Purposes: Introduction to
Contemporary Mathematics. W. H. Freeman and Company,Third
Edition, 1993.
Crisler, N., P. Fisher, and G. Froelich, Discrete Mathematics
Through Applications. W. H. Freeman and Company, 1994.
Francis, R. The Mathematician's Coloring
Book. Consortium for Mathematics and Its Applications
(COMAP), Module #13, 1989.
Garland, T. H. Fascinating Fibonaccis. Palo Alto, CA:
Dale Seymour Publications, 1987.
Kenney, M. J., Ed. Discrete Mathematics Across the Curriculum
K-12, 1991 Yearbook of the National Council of Teachers of
Mathematics (NCTM). Reston, VA, 1991.
Malkevitch, J. The Mathematical Theory of Elections.
Consortium for Mathematics and Its Applications (COMAP). Module
#1, 1985.
Malkevitch, J., G. Froelich, and D. Froelich. Codes
Galore. Consortium for Mathematics and Its Applications
(COMAP). Module #18, 1991.
Peitgen, Heinz-Otto, et al. Fractals for the Classroom:
Strategic Activities Volume One & Two. Reston, VA: NCTM and
New York: Springer-Verlag, 1992.
Rosenstein, J. G., D. Franzblau, and F. Roberts, Eds.
Discrete Mathematics in the Schools:
Making an Impact. Proceedings of a 1992 DIMACS Conference
on "Discrete Mathematics in the Schools." DIMACS Series
on Discrete Mathematics and Theoretical Computer Science.
Providence, RI: American Mathematical Society (AMS), 1997.
(Available online from this chapter in
http://dimacs.rutgers.edu/archive/nj_math_coalition/framework.html/.)
Seymour, D. Patterns in Pascal's Triangle.
Poster. Palo Alto, CA: Dale Seymour Publications.
Tannenbaum, P. and R. Arnold. Excursions in Modern
Mathematics. Prentice-Hall, 1992.
Software
-
The Chaos Game. Minnesota Educational Computer Consortium
(MECC).
On-Line Resources
-
http://dimacs.rutgers.edu/archive/nj_math_coalition/framework.html/
The Framework will be available at this site during
Spring 1997. In time, we hope to post additional resources
relating to this standard, such as grade-specific activities submitted
by New Jersey teachers, and to provide a forum to discuss the
Mathematics Standards.
|


 Activities involving systematic listing, counting, and
reasoning can be done very concretely at the K-2 grade level. For
example, dressing cardboard teddy bears with different outfits becomes
a mathematical activity when the task is to make a list of all
possible outfits and count them; pictured on the right are the six
outfits that can be arranged using one of two types of shirts and one
of three types of shorts. Similarly, playing any game involving
choices becomes a mathematical activity when children reflect on the
moves they make in the game.
 An important discrete mathematical model is that of a
network or graph, which consists of dots and lines
joining the dots; the dots are often called vertices (vertex is
the singular) and the lines are often called edges. (This is
different from other mathematical uses of the term "graph.")
The two terms "network" and "graph" are used
interchangeably for this concept. An example of a graph with seven
vertices and twelve edges is given below. You can think of the
vertices of this graph as islands in a river and the edges as
bridges. You can also think of them as buildings and roads,
or houses and telephone cables, or people and handshakes; wherever a
collection of things are joined by connectors, the mathematical model
used is that of a network or graph. At the K-2 level, children can
recognize graphs and use life-size models of graphs in various ways.
For example, a large version of this graph, or any other graph, can be
"drawn" on the floor using paper plates as vertices and
masking tape as edges. Children might select two "islands"
and find a way to go from one island to the other island by crossing
exactly four "bridges." (This can be done for any two
islands in this graph, but not necessarily in another graph.)
 Children can recognize and work with repetitive patterns
and processes involving numbers and shapes, using objects
in the classroom and in the world around them. For example, children
at the K-2 level can create (and decorate) a pattern of triangles or
squares (as pictured here) that cover a section of the floor (this is
called a "tessellation"), or start with a number and
repeatedly add three, or use clapping and movement to simulate
rhythmic patterns.
 Children at the K-2 grade levels should investigate ways of
sorting items according to attributes like color, shape,
or size, and ways of arranging data into charts, tables, and
family trees. For example, they can sort attribute blocks or stuffed
animals by color or kind, as in the diagram, and can count the number
of children who have birthdays in each month by organizing themselves
into birthday-month groups.
 On a pattern of islands and bridges laid out on the
floor, students try to find a way of visiting each island exactly
once; they can leave colored markers to keep track of islands already
visited. Note that for some patterns this may not be possible!
Students can be challenged to find a way of visiting each island
exactly once which returns them to their starting point. Similar
activities can be found in Inside, Outside, Loops, and
Lines by Herbert Kohl.
 Students "tessellate" the plane, by using
groups of squares or triangles (for example, from sets of pattern
blocks) to completely cover a sheet of paper without overlapping; they
record their patterns by tracing around the blocks on a sheet of paper
and coloring the shapes.


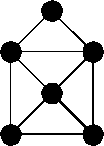
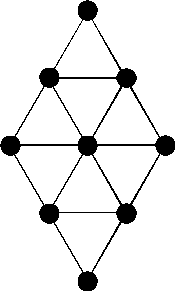
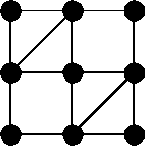
 Students create "human graphs" where
they themselves are the vertices and they use pieces of yarn (several
feet long) as edges; each piece of yarn is held by two students, one
at each end. They might create graphs with specified properties; for
example, they might create a human graph with four vertices of degree
2, or, as in the figure at the right, with six vertices of which four
have degree 3 and two have degree 2. (The degree of a vertex is
the total number of edges that meet at the vertex.) They might count
the number of different shapes of human graphs they can form with four
students (or five, or six).
 Students "tessellate" the plane using
squares, triangles, or hexagons to completely cover a sheet of paper
without overlapping. They also tessellate the plane using groups of
shapes, like hexagons and triangles as in the figure at the
right.
 Students find the shortest route from school to home
on a map (see figure at right), where each edge has a specified
numerical length in meters; students modify lengths to obtain a
different shortest route.
 Students find different ways of paving just enough
streets of a "muddy city" (like the street map at the right,
perhaps laid out on the floor) so that a child can walk from any one
location to any other location along paved roadways. In "muddy
city" none of the roads are paved, so that whenever it rains all
streets turn to mud. The mayor has asked the class to propose
different ways of paving the roads so that a person can get from any
one location to any other location on paved roads, but so that the
fewest number of roads possible are paved.
 An important discrete mathematical model is that of a
network or graph, which consists of dots and lines
joining the dots; the dots are often called vertices (vertex is
the singular) and the lines are often called edges. (This is
different from other mathematical uses of the term "graph";
the two terms "network" and "graph" are used
interchangeably for this concept.) An example of a graph with 24
vertices and 38 edges is given at the left. Graphs can be used to
represent islands and bridges, or buildings and roads, or houses and
telephone cables; wherever a collection of things are joined by
connectors, the mathematical model used is that of a graph. At the
5-6 level, students should be familiar with thenotion of a graph and
recognize situations in which graphs can be an appropriate model. For
example, they should be familiar with problems involving routes for
garbage pick-ups, school buses, mail deliveries, snow removal, etc.;
they should be able to model such problems by using graphs, and be
able to solve such problems by finding suitable paths in these graphs,
such as in the town whose street map is the graph above.


 Students use Venn diagrams to sort and then report on
their findings in a survey. For example, they can seek responses to
the question, When I grow up I want to be a) rich and
famous, b) a parent, c) in a profession I love, where
respondents can choose more than one option. The results can be
sorted into a Venn diagram like that at the right, where entries
"m" and "f" are used for male and female
students. The class can then determine answers to questions like
Are males or females in our class more likely to have a single
focus? Tabletop, Jr. software can be used to sort and
explore data using Venn diagrams.

 Students use graph coloring to solve problems which
involve avoiding conflicts such as: scheduling the school's
extra curricular activities; scheduling referees for soccer games;
determining the minimum number of aquariums needed for a specified
collection of tropical fish; and assigning channels to radio stations
to avoid interference. In the graph at the right an edge between two
animals indicates that they cannot share a habitat. The videotape,
Geometry: New Tools for New Technologies has a segment
Connecting the Dots: Vertex Coloring which discusses
the minimum number of habitats required for this situation.
 Students find a network of roads which
connects a number of sites and involves the smallest cost. In
the example at the right, what roads should be built so
as to minimize the total cost, where the number on each road
reflects the cost of building that road (in hundreds of
thousands of dollars)?
 by itself.