Results for all tracks
The PDF documents linked on this page, are no longer maintained and may not meet accessibility standards. To request an accessible version of any content, please contact us.
CVRP Results - Phase 2
The table below provides a summary of the performance of the eight teams that were invited to compete in Phase 2 testing. Full details on performance on each test instance are available in this spreadsheet: [Google sheet]
| Team | Solver | Total Points | Average PI | Median PI | Team Members |
|---|---|---|---|---|---|
| Alkaid-X | FHCSolver | 643 | 0.0526 | 0.0208 | Shibiao Jiang, Zhu He, Weibo Lin, Fuda Ma, and Zhipeng Lü |
| UFF-IC | MDM-HGS | 622 | 0.0673 | 0.0166 | Marcelo R. H. Maia, Alexandre Plastino, Uéverton S. Souza |
| AILS-II | AILSII | 536 | 0.0343 | 0.0153 | Mariá Cristina Vasconcelos Nascimento, Vinícius Rosa Máximo, Jean-François Cordeau |
| EQRS | POP-HGS | 525 | 0.0636 | 0.0236 | Eduardo Quieroga, Ruslan Sadykov |
| AXIOM1 | HGSRR | 477 | 0.0674 | 0.0261 | Martin Simensen, Geir Hasle, Magnus Stålhane |
| Route2Bo | FSP4D | 458 | 0.0878 | 0.0329 | Luca Accorsi, Francesco Cavaliere, Daniele Vigo |
| JHLVRP | MAESN | 389 | 0.0983 | 0.0324 | Jiongzhi Zheng, Xin Zheng, Yunze Wei, Kun He |
| WFI | GA+TBD | 250 | 0.1706 | 0.0776 | Stefan Voigt, Markus Frank |
CVRP Results - Phase 1
Based on their performance in Phase 1, eight teams were invited to participate in Phase 2 testing. The table below provides a summary of the performance of these teams in Phase 1.
Full details on performance of all competing solvers is available in this spreadsheet: [Google sheet]
| Team | Solver | Total Points | Average PI | Median PI | Team Members |
|---|---|---|---|---|---|
| Alkaid-X | FHCSolver | 931 | 0.1711 | 0.0498 | Shibiao Jiang, Zhu He, Weibo Lin, Fuda Ma, and Zhipeng Lü |
| UFF-IC | MDM-HGS | 896 | 0.3991 | 0.0401 | Marcelo R. H. Maia, Alexandre Plastino, Uéverton S. Souza |
| EQRS | POP-HGS | 814 | 0.4980 | 0.0444 | Eduardo Quieroga, Ruslan Sadykov |
| Route2Bo | FSP4D | 737 | 0.1614 | 0.0995 | Luca Accorsi, Francesco Cavaliere, Daniele Vigo |
| AXIOM1 | HGSRR | 678 | 0.3121 | 0.0583 | Martin Simensen, Geir Hasle, Magnus Stålhane |
| AILS-II | AILSII | 558 | 0.2814 | 0.1118 | Mariá Cristina Vasconcelos Nascimento, Vinícius Rosa Máximo, Jean-François Cordeau |
| JHLVRP | MAESN | 406 | 1.5359 | 0.0921 | Jiongzhi Zheng, Xin Zheng, Yunze Wei, Kun He |
| WFI | GA+TBD | 291 | 0.6622 | 0.1509 | Stefan Voigt, Markus Frank |
VRPTW - Phase 2
The table below provides a summary of the performance of the seven teams that were invited to compete in Phase 2 testing. Full details on performance on each test instance are available in this spreadsheet: [Google sheet]
| Team | Solver | Total Points | Average PI | Median PI | Team Members |
|---|---|---|---|---|---|
| Wouter & Co | Router | 2542 | 0.0702 | 0.0534 | Wouter Kool, Thomas Vosseler, Joep Olde Juninck, Jelke van Hoorn, Kamiel Cornelissen, Ernst Roos, Pim Agterberg |
| HustSmart | DLLSMA | 2161 | 0.3266 | 0.2005 | Zhouxing Su, Yunhao Li, Shihao Huang, Zhipeng Lü, Zhouxing Su, Junwen Ding, Fuda Ma, Weibo Lin |
| Alkaid-X | FHDSolver | 2033 | 0.4408 | 0.1211 | Shibiao Jiang, Zhu He, Weibo Lin, Fuda Ma, and Zhipeng Lü |
| Vavavuma! | LKSHP | 1483 | 0.7256 | 0.5610 | Francesco Cavaliere, Matteo Fischetti, Keld Helsgaun |
| ALNS++ | ALNS++ | 1277 | 1.0304 | 0.6462 | Stefan Røpke |
| LOG-UFPB | ILS-SP | 988 | 1.7836 | 1.5442 | Carlos Neves, Anand Subramanian |
| WFI | GA+TBD | 916 | 2.1263 | 1.8269 | Stefan Voigt, Markus Frank |
VRPTW - Phase 1
Based on their performance in Phase 1, seven teams are invited to participate in Phase 2 testing. The table below provides a summary of the performance of these teams in Phase 1.
Full details on performance of all competing solvers is available in this spreadsheet: [Google sheet]
| Team | Solver | Total Points | Average PI | Median PI | Team Members |
|---|---|---|---|---|---|
| Wouter & Co | Router | 3219 | 0.0940 | 0.0235 | Wouter Kool, Thomas Vosseler, Joep Olde Juninck, Jelke van Hoorn, Kamiel Cornelissen, Ernst Roos, Pim Agterberg |
| Alkaid-X | FHDSolver | 2345 | 0.5166 | 0.0939 | Shibiao Jiang, Zhu He, Weibo Lin, Fuda Ma, and Zhipeng Lü |
| HustSmart | DLLSMA | 2242 | 0.3602 | 0.1737 | Zhouxing Su, Yunhao Li, Shihao Huang, Zhipeng Lü, Zhouxing Su, Junwen Ding, Fuda Ma, Weibo Lin |
| Vavavuma! | LKSHP | 1823 | 0.5513 | 0.3409 | Francesco Cavaliere, Matteo Fischetti, Keld Helsgaun |
| LOG-UFPB | ILS-SP | 1340 | 1.1912 | 0.8300 | Carlos Neves, Anand Subramanian |
| WFI | GA+TBD | 1186 | 1.3466 | 0.5895 | Stefan Voigt, Markus Frank |
| ALNS++ | ALNS++ | 1178 | 0.8778 | 0.6439 | Stefan Røpke |
SDVRP Results
Seven teams submitted results for the Split-delivery Vehicle Routing Problem. The table below summarizes the performance of these teams. We note that the "score" is a value between 0 and 10 that is assigned for each instance. A value of 0 indicates that the solver delivered the best solution among the entries; whereas a score of 10 indicates that is more than 10% higher than the best solution. Based on the score teams are awarded points -- 10 for the best score (0); 8 for the second best; 6 for the third best; 5 for the fourth best; 4 for the fifth; 3 for the sixth.
Full details on performance of all competing solvers is available in this spreadsheet: [Google sheet]
| Team | Solver | Points | Ave Score | Team Members |
|---|---|---|---|---|
| Alkaid-X | AlkaidSD | 798.19 | 0.0021 | Weibo Lin, Zhu He, Shibiao Jiang, Fuda Ma, Zhipeng Lü |
| LERIA | SplitMA | 646.44 | 0.2590 | Jin-Kao Hao, Pengfei He |
| Øptimizers | strime | 530.69 | 0.3548 | Mette Gamst, Richard Martin Lusby, Stefan Røpke |
| NTNU AXIOM | GoodStuff | 504.14 | 0.3842 | Simen Tung Vadseth, Jørgen Skålnes, Magnus Stålhane, Henrik Andersson |
| Split & Conquer | SplitLS | 490.59 | 0.3868 | Marcos de Melo da Silva, Anand Subramanian |
| Split and Conquer | VeRoSplit | 433.19 | 0.6420 | Pedro Munari, Aldair Alvarez |
| Starry Sky | FBPAIS | 24.79 | 8.5116 | Bohan Zhuang, Sipeng Sun |
IRP Results
Five teams successfully submitted results for the Inventory Routing Problem. The table below summarizes the performance of these teams. We note that the "score" is a value between 0 and 10 that is assigned for each instance. A value of 0 indicates that the solver delivered the best solution among the entries; whereas a score of 10 indicates that is more than 10% higher than the best solution. Based on the score teams are awarded points -- 10 for the best score (0); 8 for the second best; 6 for the third best; 5 for the fourth best; 4 for the fifth.
Full details on performance of all competing solvers is available in this spreadsheet: [Google sheet]
| Team | Solver | Ave Points | Ave Score | Team Members |
|---|---|---|---|---|
| NTNU AXIOM | MrOptimal | 7.574 | 0.1536 | Simen Tung Vadseth, Jørgen Skålnes, Magnus Stålhane, Henrik Andersson |
| GSCC | 2FHBC | 7.354 | 0.3504 | Thiago A. Guimaraes, Cleder M. Schenekemberg, Leandro C. Coelho, Antonio A. Chaves |
| SmartLab | TSMHA | 6.691 | 0.4238 | Zhouxing Su, Shihao Huang ,Yunhao Li, Zhipeng Lü, Junwen Ding |
| PUC-Rio | IRPUC++ | 6.639 | 0.5831 | Rafael Martinelli, Pedro Diniz, Bruno Castro, Marcus Poggi |
| sb | plasir | 4.742 | 4.2658 | Stephan Beyer |
Dynamic Ride Hailing
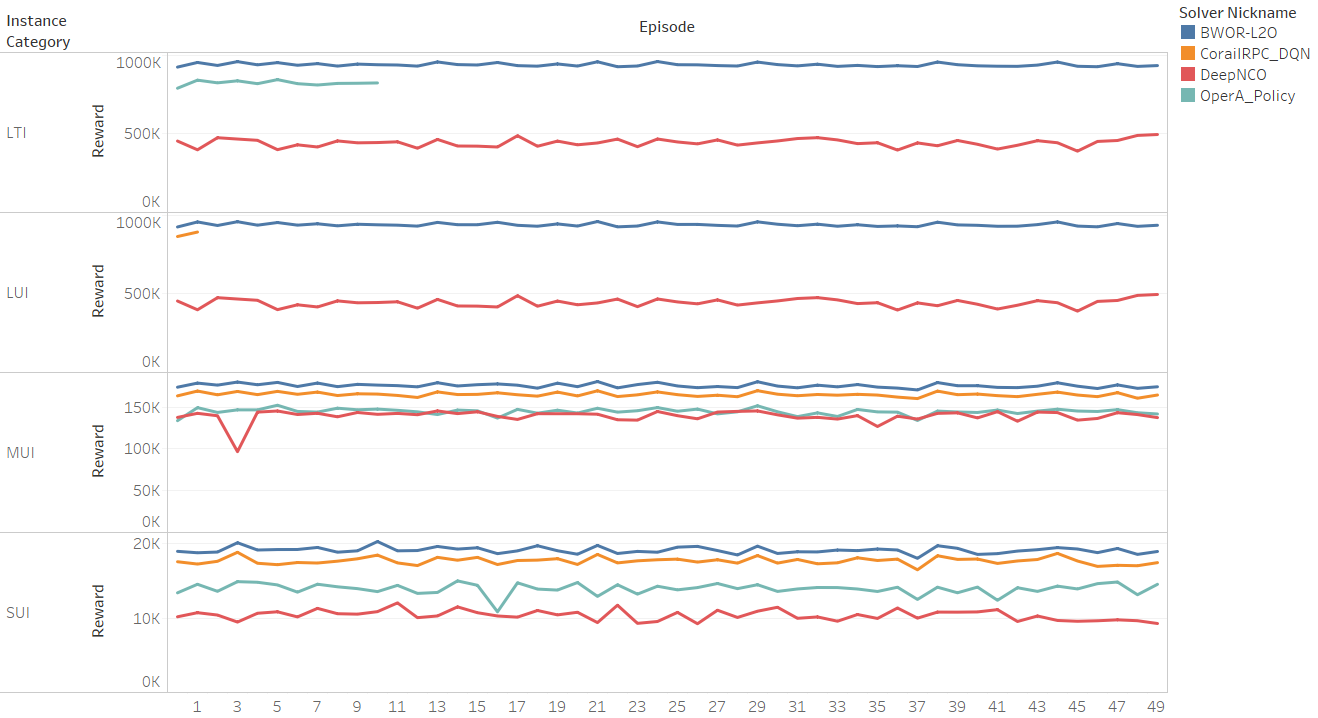
The table and graphic below provide a summary of the performance of the four teams competing in the Ride-hailing track. The solver BWOR-L20 was declared the overall winner, as it delivered the best performance in all instance categories.
| Instance Category | |||||||||||
|---|---|---|---|---|---|---|---|---|---|---|---|
| Listed Alphabetically | Small Untimed Instances (SUI) | Med. Untimed Instances (MUI) | Large Untimed Instances (LUI) | Large Timed Instances (LTI) | Numbers in RED are based on incomplete data | ||||||
| Team | Solver | Average | Std. Dev | Average | Std. Dev | Average | Std. Dev | Average | Std. Dev | Team Members | |
| BWOR | BWOR-L20 | 19,141 | 431 | 175,877 | 2,456 | 938,348 | 10,134 | 938,287 | 10,210 | Christian Ackermann, Julia Rieck | |
| CORAIL | CORAILRPC | 17,696 | 472 | 165,210 | 2,363 | 877,668 | 20,021 | -- | -- | Augustin Parjadis, Quentin Cappart, Louis-Martin Rousseau | |
| NCO | DeepNCO | 10,386 | 691 | 139,420 | 7,309 | 442,592 | 24,925 | 442,592 | 24,925 | Ali Yaddaden, Sébastien Harispe, Michel Vasquez | |
| OperA | OperA | 13,950 | 746 | 144,738 | 3,694 | -- | -- | 822,338 | 15,123 | Caroline Jagtenberg, Nanne Dieleman | |
Performance of the four solvers on the four different instance categories is shown in the graph(s) below. Note that only two solvers completes runs for the large instances LUI and LTI. Clicking the image will open a higher resolution PDF in a new window.