CVRP Results - Phase 2
The table below provides a summary of the performance of the eight teams that were invited to compete in Phase 2 testing. Full details on performance on each test instance are available in this spreadsheet: [Google sheet]
CVRP Results - Phase 1
Based on their performance in Phase 1, eight teams were invited to participate in Phase 2 testing. The table below provides a summary of the performance of these teams in Phase 1.
Full details on performance of all competing solvers is available in this spreadsheet: [Google sheet]
VRPTW - Phase 2
The table below provides a summary of the performance of the seven teams that were invited to compete in Phase 2 testing. Full details on performance on each test instance are available in this spreadsheet: [Google sheet]
VRPTW - Phase 1
Based on their performance in Phase 1, seven teams are invited to participate in Phase 2 testing. The table below provides a summary of the performance of these teams in Phase 1.
Full details on performance of all competing solvers is available in this spreadsheet: [Google sheet]
SDVRP Results
Seven teams submitted results for the Split-delivery Vehicle Routing Problem. The table below summarizes the performance of these teams. We note that the "score" is a value between 0 and 10 that is assigned for each instance. A value of 0 indicates that the solver delivered the best solution among the entries; whereas a score of 10 indicates that is more than 10% higher than the best solution. Based on the score teams are awarded points -- 10 for the best score (0); 8 for the second best; 6 for the third best; 5 for the fourth best; 4 for the fifth; 3 for the sixth.
Full details on performance of all competing solvers is available in this spreadsheet: [Google sheet]
IRP Results
Five teams successfully submitted results for the Inventory Routing Problem. The table below summarizes the performance of these teams. We note that the "score" is a value between 0 and 10 that is assigned for each instance. A value of 0 indicates that the solver delivered the best solution among the entries; whereas a score of 10 indicates that is more than 10% higher than the best solution. Based on the score teams are awarded points -- 10 for the best score (0); 8 for the second best; 6 for the third best; 5 for the fourth best; 4 for the fifth.
Full details on performance of all competing solvers is available in this spreadsheet: [Google sheet]
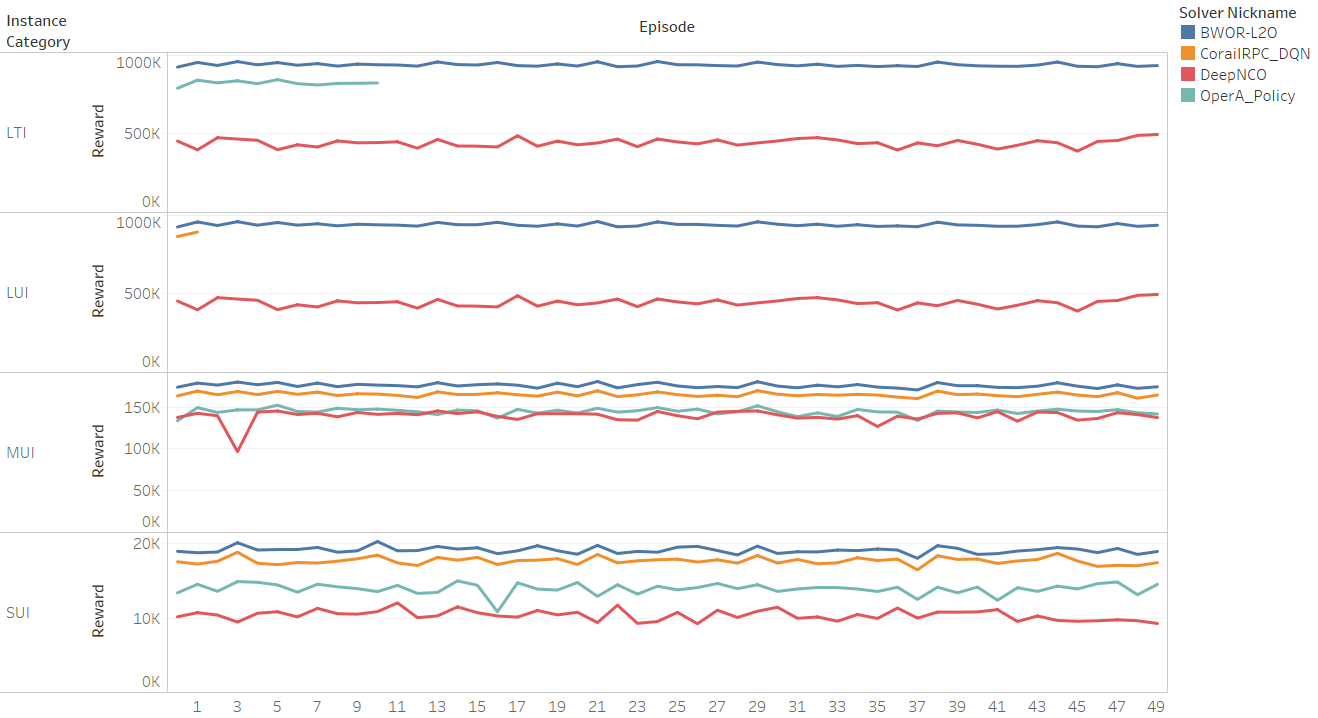
Dynamic Ride Hailing
The table and graphic below provide a summary of the performance of the four teams competing in the Ride-hailing track. The solver BWOR-L20 was declared the overall winner, as it delivered the best performance in all instance categories.
Performance of the four solvers on the four different instance categories is shown in the graph(s) below. Note that only two solvers completes runs for the large instances LUI and LTI. Clicking the image will open a higher resolution PDF in a new window.